
- Home >
- Stock Photos >
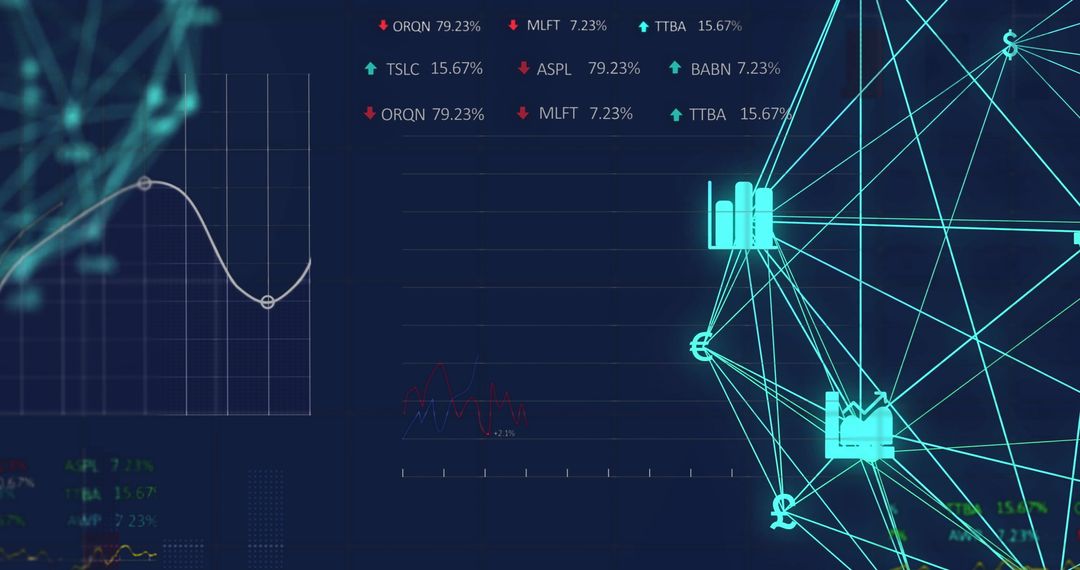
- Financial Data Chart with Digital Display Over Blue Grid
Financial Data Chart with Digital Display Over Blue Grid Image

Illustrates financial data visualization suitable for business finance themes. Useful for depicting global market analysis, economic trends, or technology-driven finances. Ideal in articles, presentations, or educational materials focused on understanding financial models or economic data representation.
Powered by  - Get 15% off with code: PIKWIZARD15


2
downloads
downloads
Tags:
More
Credit Photo
If you would like to credit the Photo, here are some ways you can do so
Text Link
photo Link
<span class="text-link">
<span>
<a target="_blank" href=https://pikwizard.com/photo/financial-data-chart-with-digital-display-over-blue-grid/553be6bd22587cc5ab99d486dcb6e826/>PikWizard</a>
</span>
</span>
<span class="image-link">
<span
style="margin: 0 0 20px 0; display: inline-block; vertical-align: middle; width: 100%;"
>
<a
target="_blank"
href="https://pikwizard.com/photo/financial-data-chart-with-digital-display-over-blue-grid/553be6bd22587cc5ab99d486dcb6e826/"
style="text-decoration: none; font-size: 10px; margin: 0;"
>
<img src="https://pikwizard.com/pw/medium/553be6bd22587cc5ab99d486dcb6e826.jpg" style="margin: 0; width: 100%;" alt="" />
<p style="font-size: 12px; margin: 0;">PikWizard</p>
</a>
</span>
</span>
Free (free of charge)
Free for personal and commercial use.
Author: Creative Art
Similar Free Stock Images

Premium


Premium


Premium


Premium


Premium


Premium


Premium


Premium


Premium


Premium


Premium


Premium


Premium


Premium


Premium


Premium


Premium


Premium


Premium


Premium


Premium


Premium


Premium


Premium

