- Home >
- Stock Photos >
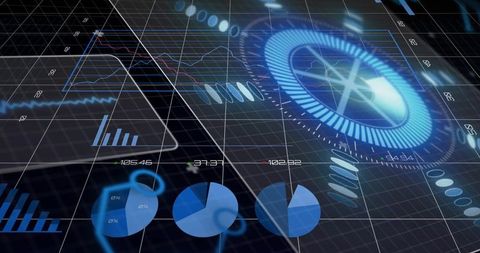
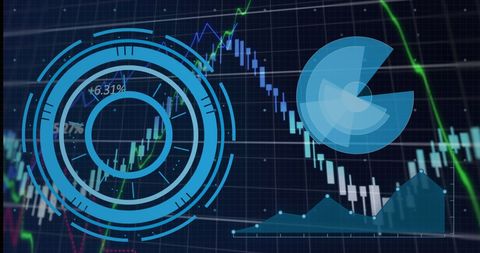
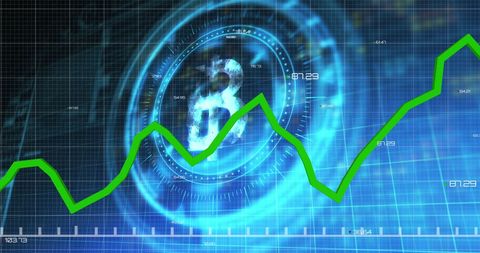
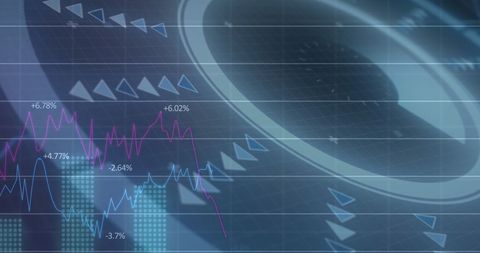
- Financial Data Chart with Technology Interface Background
Financial Data Chart with Technology Interface Background Image
The graphic representation of fluctuating financial data set against a modern digital interface communicates innovation in financial analysis. With variable graph lines depicted across a high-tech backdrop, the composition suggests dynamism in data trends, making it a strong choice for illustrating financial reporting, analytics, and strategies.

downloads
Tags:
More
Credit Photo
If you would like to credit the Photo, here are some ways you can do so
Text Link
photo Link
<span class="text-link">
<span>
<a target="_blank" href=https://pikwizard.com/photo/financial-data-chart-with-technology-interface-background/e80dffca8c85604f2de104bbcb3d9339/>PikWizard</a>
</span>
</span>
<span class="image-link">
<span
style="margin: 0 0 20px 0; display: inline-block; vertical-align: middle; width: 100%;"
>
<a
target="_blank"
href="https://pikwizard.com/photo/financial-data-chart-with-technology-interface-background/e80dffca8c85604f2de104bbcb3d9339/"
style="text-decoration: none; font-size: 10px; margin: 0;"
>
<img src="https://pikwizard.com/pw/medium/e80dffca8c85604f2de104bbcb3d9339.jpg" style="margin: 0; width: 100%;" alt="" />
<p style="font-size: 12px; margin: 0;">PikWizard</p>
</a>
</span>
</span>
Free (free of charge)
Free for personal and commercial use.
Author: Creative Art