- Home >
- Stock Photos >
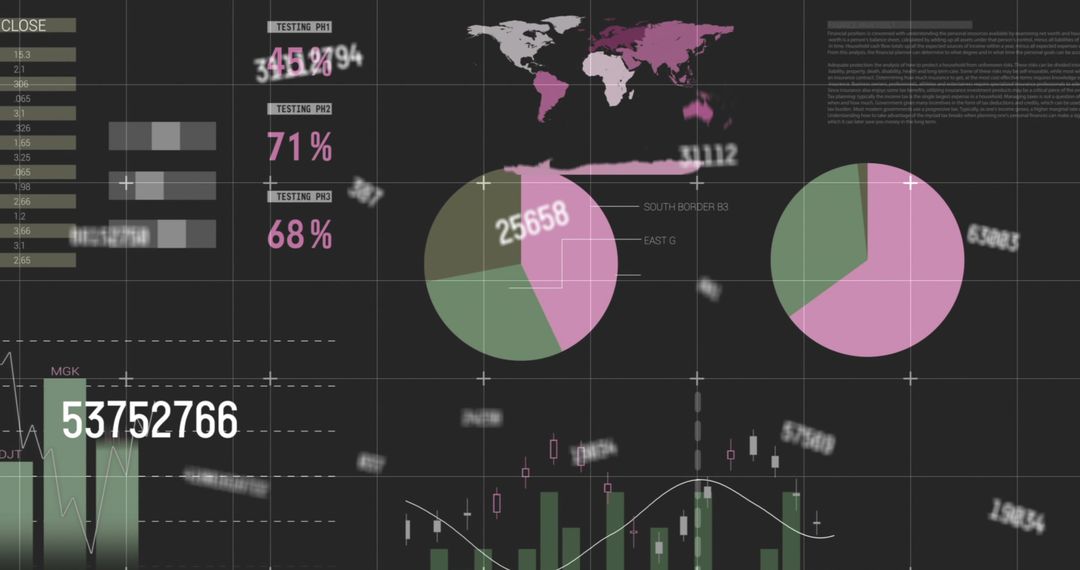
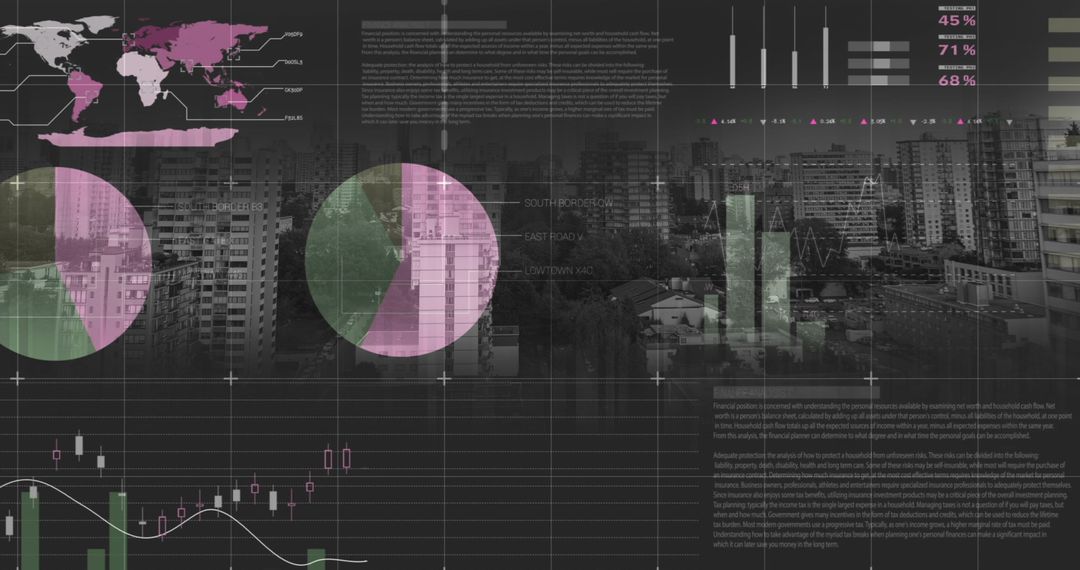
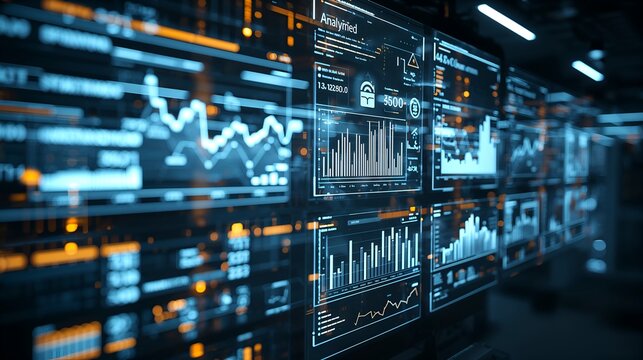
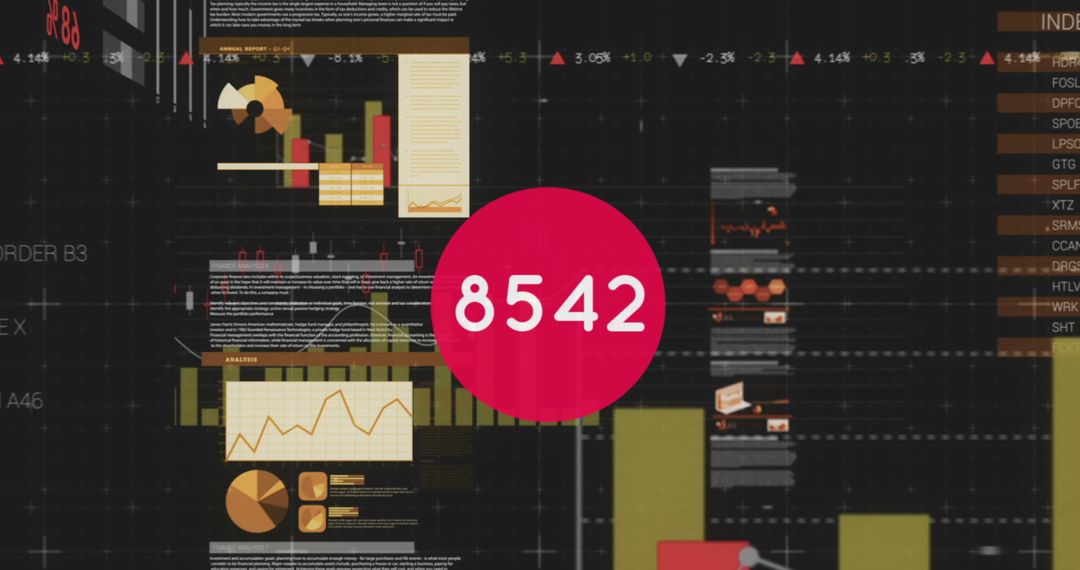
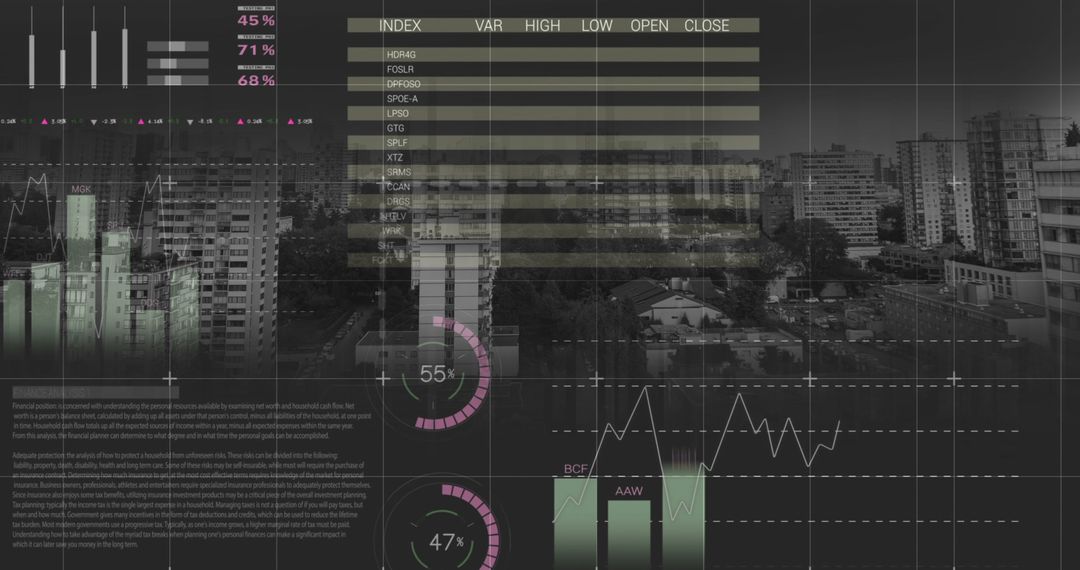
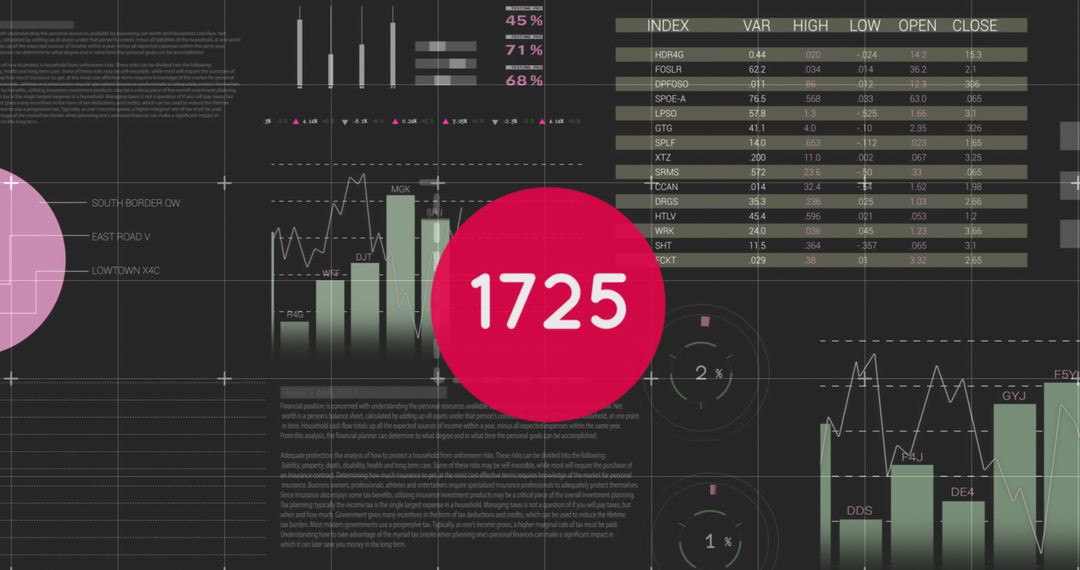
- Financial Data Charts & Analysis on Dark Screen
Financial Data Charts & Analysis on Dark Screen Image

Depicts various financial charts and statistics over dark background with a focus on data analysis and processing. Ideal for illustrating concepts in global finance, business strategy development, computational finance techniques, or big data analytics. Useful for content involving investment research, market reporting, or financial technology solutions.
Powered by 


2
downloads
downloads
Tags:
More
Credit Photo
If you would like to credit the Photo, here are some ways you can do so
Text Link
photo Link
<span class="text-link">
<span>
<a target="_blank" href=https://pikwizard.com/photo/financial-data-charts-and-analysis-on-dark-screen/9fe84a27f1d9d89b68235dc2a80b10ee/>PikWizard</a>
</span>
</span>
<span class="image-link">
<span
style="margin: 0 0 20px 0; display: inline-block; vertical-align: middle; width: 100%;"
>
<a
target="_blank"
href="https://pikwizard.com/photo/financial-data-charts-and-analysis-on-dark-screen/9fe84a27f1d9d89b68235dc2a80b10ee/"
style="text-decoration: none; font-size: 10px; margin: 0;"
>
<img src="https://pikwizard.com/pw/medium/9fe84a27f1d9d89b68235dc2a80b10ee.jpg" style="margin: 0; width: 100%;" alt="" />
<p style="font-size: 12px; margin: 0;">PikWizard</p>
</a>
</span>
</span>
Free (free of charge)
Free for personal and commercial use.
Author: People Creations
Similar Free Stock Images

Premium


Premium


Premium


Premium


Premium


Premium


Premium


Premium


Premium


Premium


Premium


Premium


Premium


Premium


Premium


Premium


Premium


Premium


Premium


Premium


Premium


Premium


Premium


Premium