- Home >
- Stock Photos >
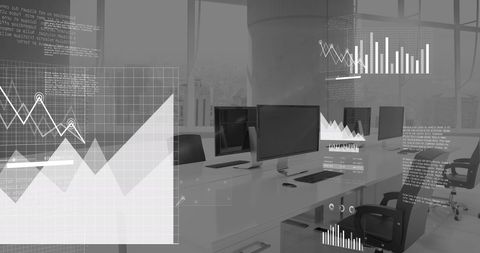
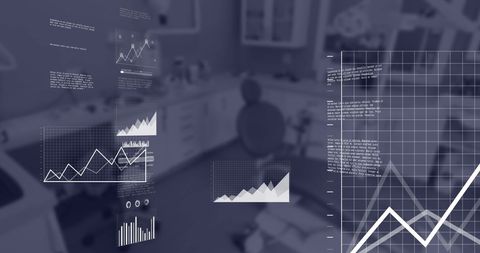
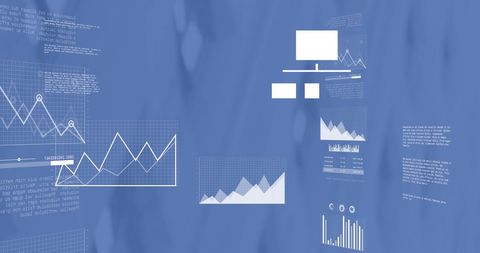
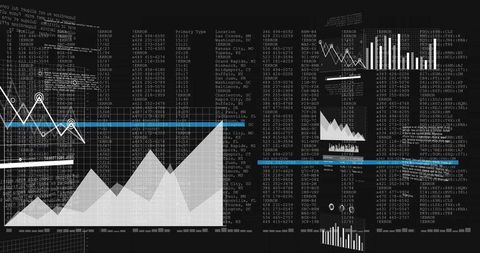
- Financial Data Charts and Graphs in Office Environment
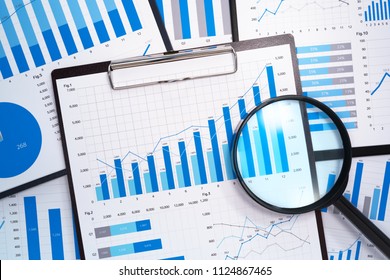
Financial Data Charts and Graphs in Office Environment Image

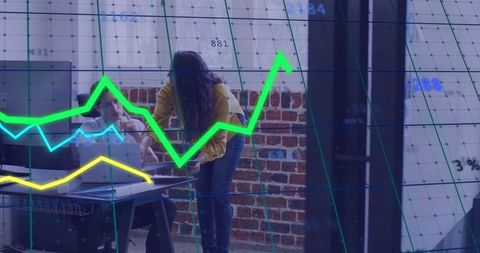
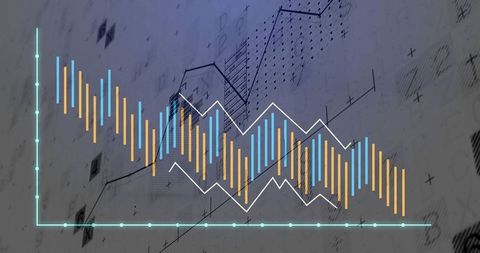
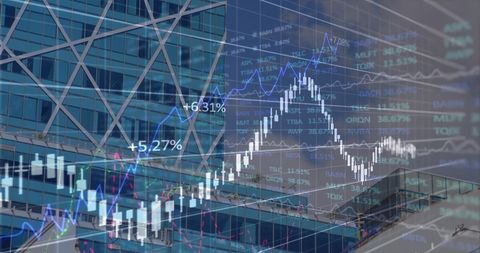
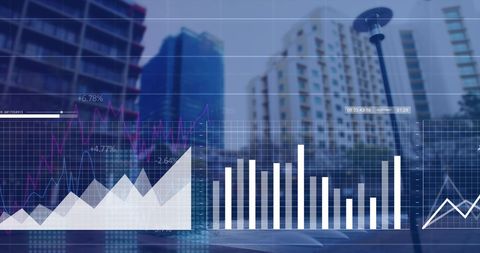
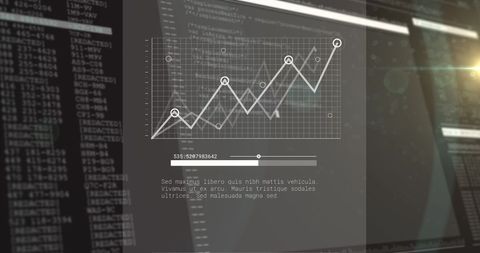
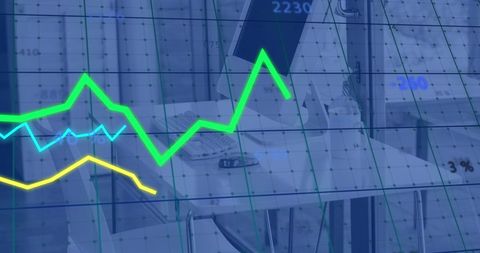
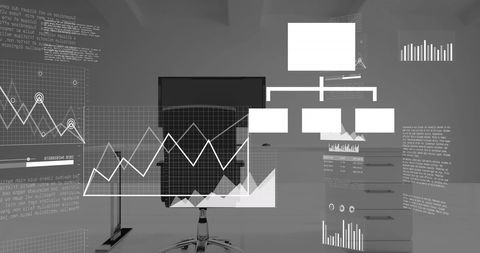
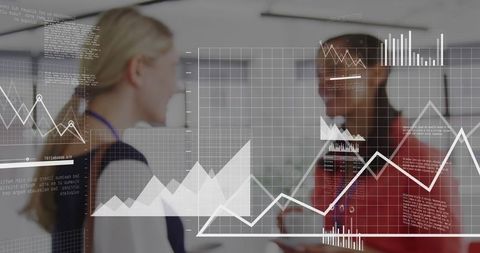
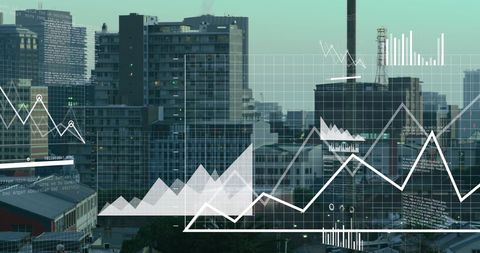
Depicts financial data visualization in an office setting, featuring various charts and graphs. Utilized in contexts involving business analytics, finance presentations, and global finance strategies. Ideal for illustrating concepts related to technological advancements in financial data processing and analytics.
Powered by  - Get 15% off with code: PIKWIZARD15


2
downloads
downloads
Tags:
More
Credit Photo
If you would like to credit the Photo, here are some ways you can do so
Text Link
photo Link
<span class="text-link">
<span>
<a target="_blank" href=https://pikwizard.com/photo/financial-data-charts-and-graphs-in-office-environment/38358990407a3933033afe519fd31806/>PikWizard</a>
</span>
</span>
<span class="image-link">
<span
style="margin: 0 0 20px 0; display: inline-block; vertical-align: middle; width: 100%;"
>
<a
target="_blank"
href="https://pikwizard.com/photo/financial-data-charts-and-graphs-in-office-environment/38358990407a3933033afe519fd31806/"
style="text-decoration: none; font-size: 10px; margin: 0;"
>
<img src="https://pikwizard.com/pw/medium/38358990407a3933033afe519fd31806.jpg" style="margin: 0; width: 100%;" alt="" />
<p style="font-size: 12px; margin: 0;">PikWizard</p>
</a>
</span>
</span>
Free (free of charge)
Free for personal and commercial use.
Author: Awesome Content
Similar Free Stock Images
Loading...
Premium


Premium


Premium


Premium


Premium


Premium


Premium


Premium

Premium


Premium


Premium


Premium
Premium


Premium
Premium

Premium

Premium


Premium


Premium


Premium


Premium


Premium


Premium


Premium

Premium