
- Home >
- Stock Photos >
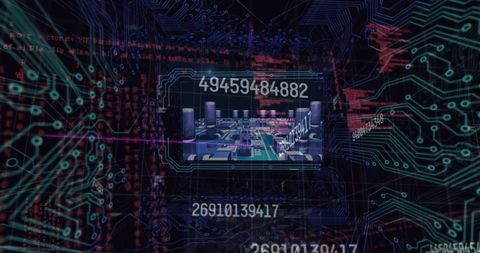
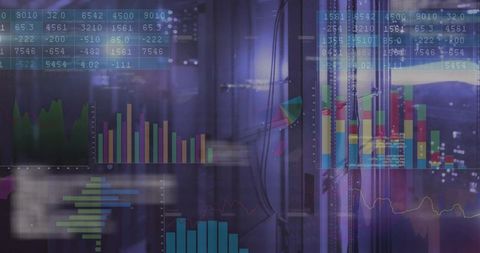
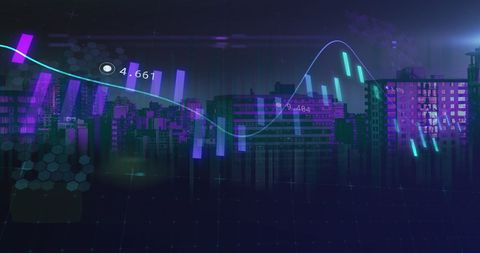
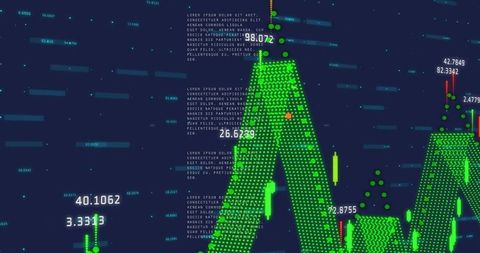
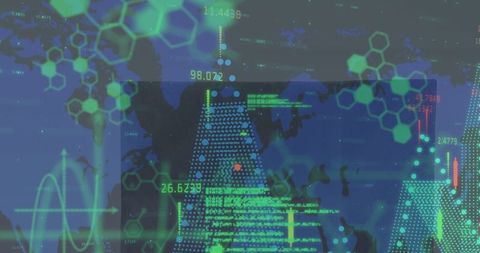
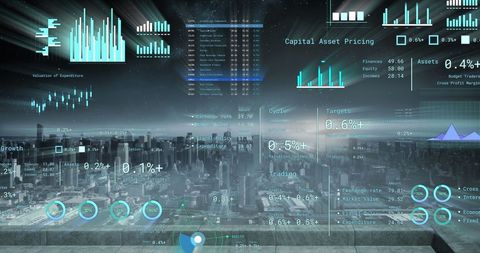
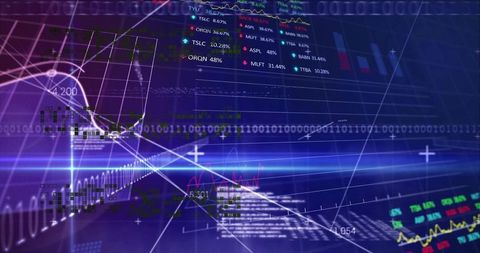
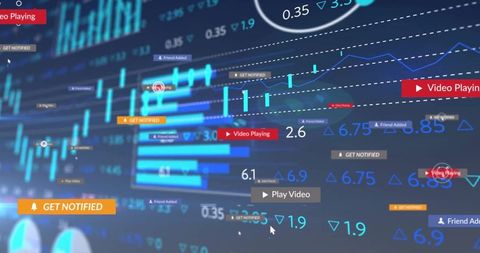
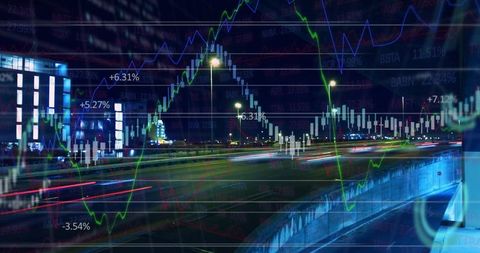
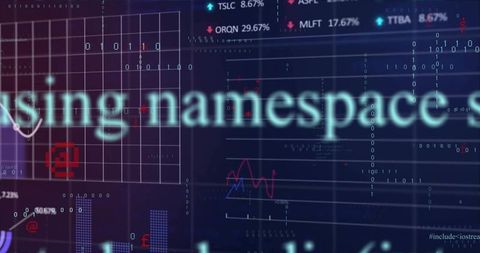
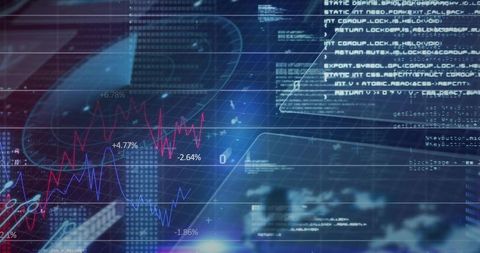
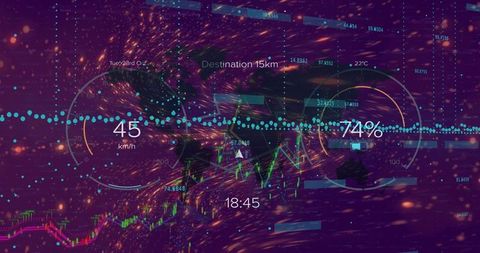
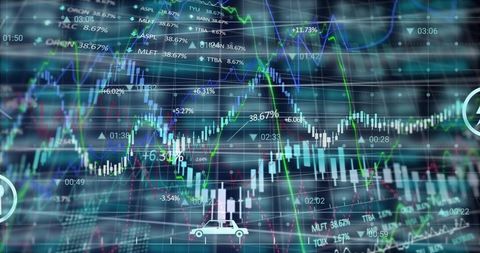
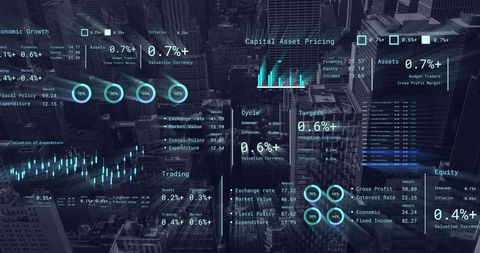
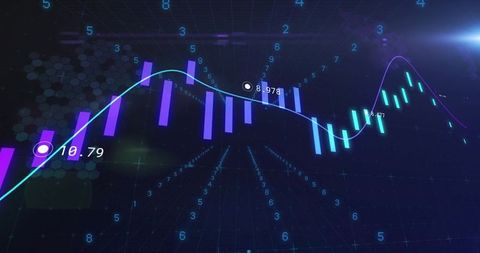
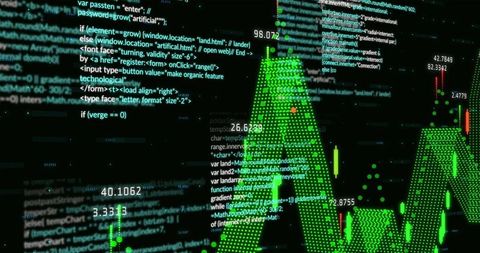
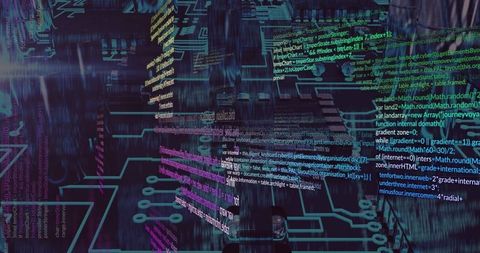
- Financial Data Charts Blended with Programming Code on Dark Background
Financial Data Charts Blended with Programming Code on Dark Background Image
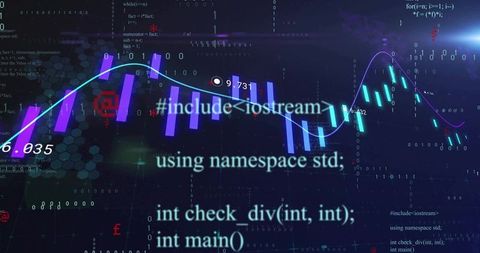
Futuristic and dynamic depiction of technological advancements in finance and programming. Useful for illustrating articles or presentations focused on financial technology, cybersecurity threats, algorithmic trading, or programming education. Ideal for highlighting how code impacts financial markets in tech blogs and business forecasts.
Powered by 


downloads
Tags:
More
Credit Photo
If you would like to credit the Photo, here are some ways you can do so
Text Link
photo Link
<span class="text-link">
<span>
<a target="_blank" href=https://pikwizard.com/photo/financial-data-charts-blended-with-programming-code-on-dark-background/494317b3be7e8157223709b8b4c6ff50/>PikWizard</a>
</span>
</span>
<span class="image-link">
<span
style="margin: 0 0 20px 0; display: inline-block; vertical-align: middle; width: 100%;"
>
<a
target="_blank"
href="https://pikwizard.com/photo/financial-data-charts-blended-with-programming-code-on-dark-background/494317b3be7e8157223709b8b4c6ff50/"
style="text-decoration: none; font-size: 10px; margin: 0;"
>
<img src="https://pikwizard.com/pw/medium/494317b3be7e8157223709b8b4c6ff50.jpg" style="margin: 0; width: 100%;" alt="" />
<p style="font-size: 12px; margin: 0;">PikWizard</p>
</a>
</span>
</span>
Free (free of charge)
Free for personal and commercial use.
Author: People Creations
Similar Free Stock Images
Premium

Premium
Premium


Premium


Premium

Premium


Premium

Premium


Premium

Premium


Premium

Premium
Premium

Premium


Premium


Premium
Premium


Premium

Premium


Premium


Premium


Premium
Premium


Premium


Premium
Explore More Free Stock Images