
- Home >
- Stock Photos >
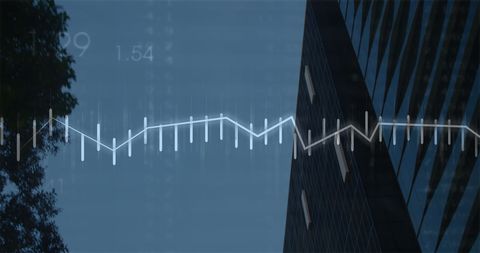
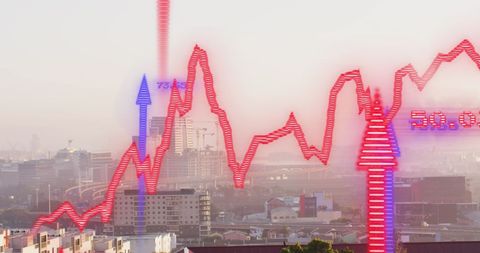
- Financial Data Charts Displayed Over Skyscraper Reflection
Financial Data Charts Displayed Over Skyscraper Reflection Image

Image showcases dynamic financial data charts set against the reflective surface of a building. Ideal for use in presentations, articles, and marketing materials focused on finance, economic trends, data analytics, or business technologies. Highlights the intersection of digital technology with the aggression of markets, capturing a sense of momentum and global finance dynamics.
Powered by  - Get 15% off with code: PIKWIZARD15


downloads
Tags:
More
Credit Photo
If you would like to credit the Photo, here are some ways you can do so
Text Link
photo Link
<span class="text-link">
<span>
<a target="_blank" href=https://pikwizard.com/photo/financial-data-charts-displayed-over-skyscraper-reflection/12836c484b2311ccd422bcdd86ae8d57/>PikWizard</a>
</span>
</span>
<span class="image-link">
<span
style="margin: 0 0 20px 0; display: inline-block; vertical-align: middle; width: 100%;"
>
<a
target="_blank"
href="https://pikwizard.com/photo/financial-data-charts-displayed-over-skyscraper-reflection/12836c484b2311ccd422bcdd86ae8d57/"
style="text-decoration: none; font-size: 10px; margin: 0;"
>
<img src="https://pikwizard.com/pw/medium/12836c484b2311ccd422bcdd86ae8d57.jpg" style="margin: 0; width: 100%;" alt="" />
<p style="font-size: 12px; margin: 0;">PikWizard</p>
</a>
</span>
</span>
Free (free of charge)
Free for personal and commercial use.
Author: Awesome Content
Similar Free Stock Images

Premium


Premium


Premium


Premium

Premium


Premium

Premium


Premium


Premium

Premium


Premium

Premium


Premium


Premium

Premium


Premium


Premium


Premium

Premium


Premium


Premium


Premium


Premium


Premium


Premium


Explore More Free Stock Images