
- Home >
- Stock Photos >
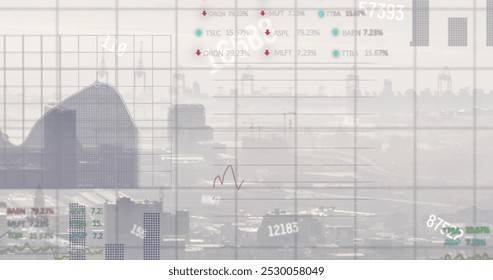
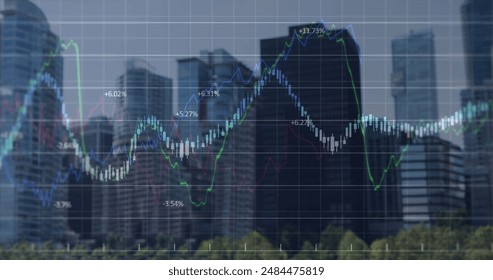
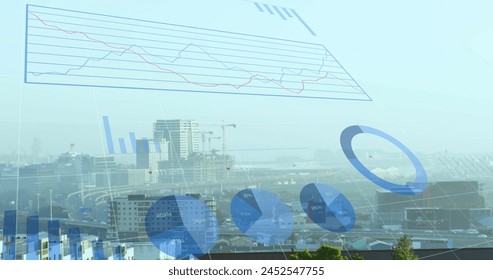
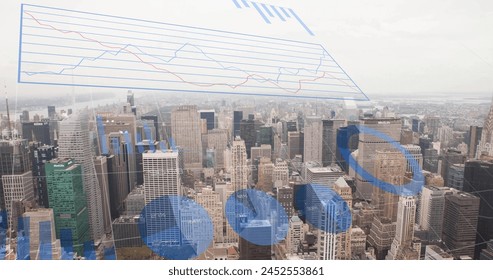
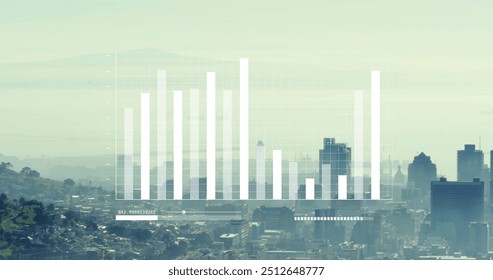
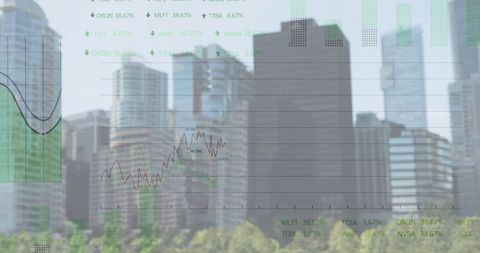
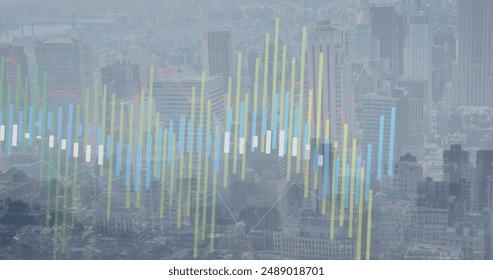
- Financial Data Charts Overlay Cityscape Skyline
Financial Data Charts Overlay Cityscape Skyline Image

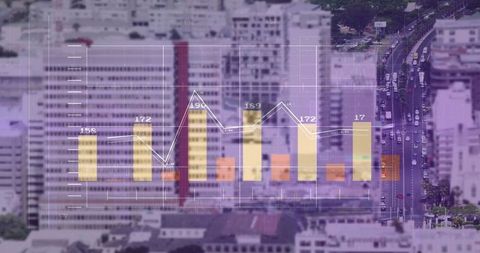
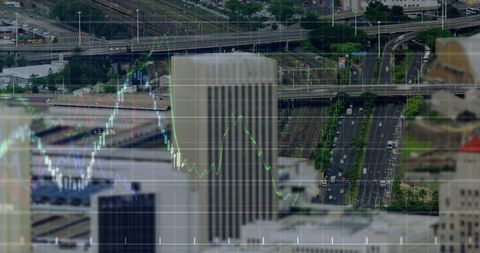
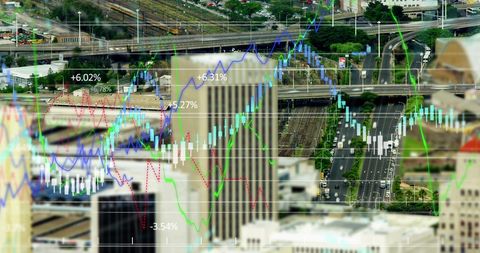
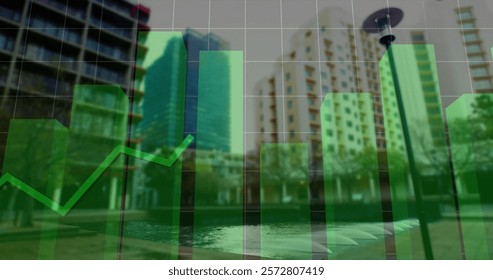
Colorful graphs and data superimposed over cityscape illustrate connection between urban innovation and economic movement. Perfect for uses in financial industry, business articles, global economic analysis reports, investment presentations, and technology publication referencing smart cities and financial growth.
Powered by  - Get 15% off with code: PIKWIZARD15


downloads
Tags:
More
Credit Photo
If you would like to credit the Photo, here are some ways you can do so
Text Link
photo Link
<span class="text-link">
<span>
<a target="_blank" href=https://pikwizard.com/photo/financial-data-charts-overlay-cityscape-skyline/4672862e87eedc63ef5bb47d42050ea9/>PikWizard</a>
</span>
</span>
<span class="image-link">
<span
style="margin: 0 0 20px 0; display: inline-block; vertical-align: middle; width: 100%;"
>
<a
target="_blank"
href="https://pikwizard.com/photo/financial-data-charts-overlay-cityscape-skyline/4672862e87eedc63ef5bb47d42050ea9/"
style="text-decoration: none; font-size: 10px; margin: 0;"
>
<img src="https://pikwizard.com/pw/medium/4672862e87eedc63ef5bb47d42050ea9.jpg" style="margin: 0; width: 100%;" alt="" />
<p style="font-size: 12px; margin: 0;">PikWizard</p>
</a>
</span>
</span>
Free (free of charge)
Free for personal and commercial use.
Author: Creative Art
Similar Free Stock Images

Premium


Premium


Premium


Premium


Premium


Premium


Premium


Premium

Premium

Premium


Premium


Premium


Premium


Premium

Premium


Premium

Premium


Premium


Premium


Premium


Premium


Premium


Premium


Premium


Premium


Explore More Free Stock Images