
- Home >
- Stock Photos >
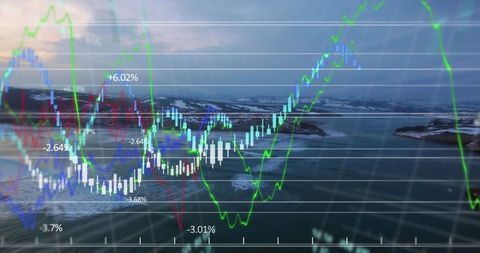
- Financial Data Concept with Graphs and Neon Text Elements
Financial Data Concept with Graphs and Neon Text Elements Image

Financial graphs with neon-colored text and decorative stars convey a conceptual blend of technology and finance. Suitable for illustrating business reports, presentations on market trends, or articles on economic growth.
Powered by  - Get 15% off with code: PIKWIZARD15


downloads
Tags:
More
Credit Photo
If you would like to credit the Photo, here are some ways you can do so
Text Link
photo Link
<span class="text-link">
<span>
<a target="_blank" href=https://pikwizard.com/photo/financial-data-concept-with-graphs-and-neon-text-elements/f123a10cddb4531c3b6aa7ad7a5a79c1/>PikWizard</a>
</span>
</span>
<span class="image-link">
<span
style="margin: 0 0 20px 0; display: inline-block; vertical-align: middle; width: 100%;"
>
<a
target="_blank"
href="https://pikwizard.com/photo/financial-data-concept-with-graphs-and-neon-text-elements/f123a10cddb4531c3b6aa7ad7a5a79c1/"
style="text-decoration: none; font-size: 10px; margin: 0;"
>
<img src="https://pikwizard.com/pw/medium/f123a10cddb4531c3b6aa7ad7a5a79c1.jpg" style="margin: 0; width: 100%;" alt="" />
<p style="font-size: 12px; margin: 0;">PikWizard</p>
</a>
</span>
</span>
Free (free of charge)
Free for personal and commercial use.
Author: Creative Art
Similar Free Stock Images

Premium


Premium


Premium

Premium


Premium


Premium


Premium


Premium


Premium


Premium


Premium


Premium


Premium

Premium


Premium


Premium


Premium


Premium


Premium


Premium

Premium


Premium


Premium


Premium


Premium

Explore More Free Stock Images