- Home >
- Stock Photos >
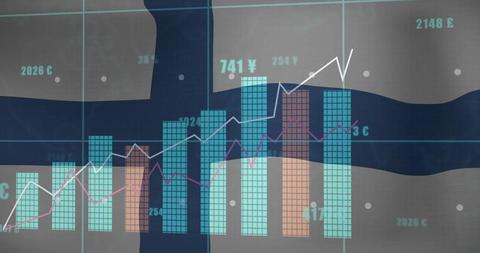
- Financial data dashboard showing rising bar charts and trend lines over city glass facade
Financial data dashboard showing rising bar charts and trend lines over city glass facade Image

Showing turquoise and orange stacked bars with white and magenta trend lines over glass facade reflection and urban architecture, featuring currency labels yen (¥) and pound (£) for international finance context. Composing strong vertical rhythm and intersecting trend lines for sense of movement and growth. Ideal for illustrating market analysis, investment performance, revenue growth, fintech dashboard mockups, and corporate financial reports. Working well as hero banner, presentation slide background, website header, infographic backdrop, brochure cover, and social media campaign creative. Pairing with bold sans serif headlines, transparent overlays for text, and muted color accents for legibility. Recommending horizontal crops for website banners and 4x5 vertical crops for social ads. Supplying visual metaphor for data transparency, urban economy, and digital analytics.
Powered by  - Get 15% off with code: PIKWIZARD15


0
downloads
downloads
Tags:
More
Credit Photo
If you would like to credit the Photo, here are some ways you can do so
Text Link
photo Link
<span class="text-link">
<span>
<a target="_blank" href=https://pikwizard.com/photo/financial-data-dashboard-showing-rising-bar-charts-and-trend-lines-over-city-glass-facade/a27e73f7e9fd674244b1baed9996740d/>PikWizard</a>
</span>
</span>
<span class="image-link">
<span
style="margin: 0 0 20px 0; display: inline-block; vertical-align: middle; width: 100%;"
>
<a
target="_blank"
href="https://pikwizard.com/photo/financial-data-dashboard-showing-rising-bar-charts-and-trend-lines-over-city-glass-facade/a27e73f7e9fd674244b1baed9996740d/"
style="text-decoration: none; font-size: 10px; margin: 0;"
>
<img src="https://pikwizard.com/pw/medium/a27e73f7e9fd674244b1baed9996740d.jpg" style="margin: 0; width: 100%;" alt="" />
<p style="font-size: 12px; margin: 0;">PikWizard</p>
</a>
</span>
</span>
Free (free of charge)
Free for personal and commercial use.
Author: Awesome Content
Similar Free Stock Images

Premium


Premium


Premium


Premium


Premium


Premium


Premium


Premium


Premium


Premium


Premium


Premium


Premium


Premium


Premium


Premium


Premium


Premium


Premium


Premium


Premium


Premium


Premium


Premium


Premium