- Home >
- Stock Photos >
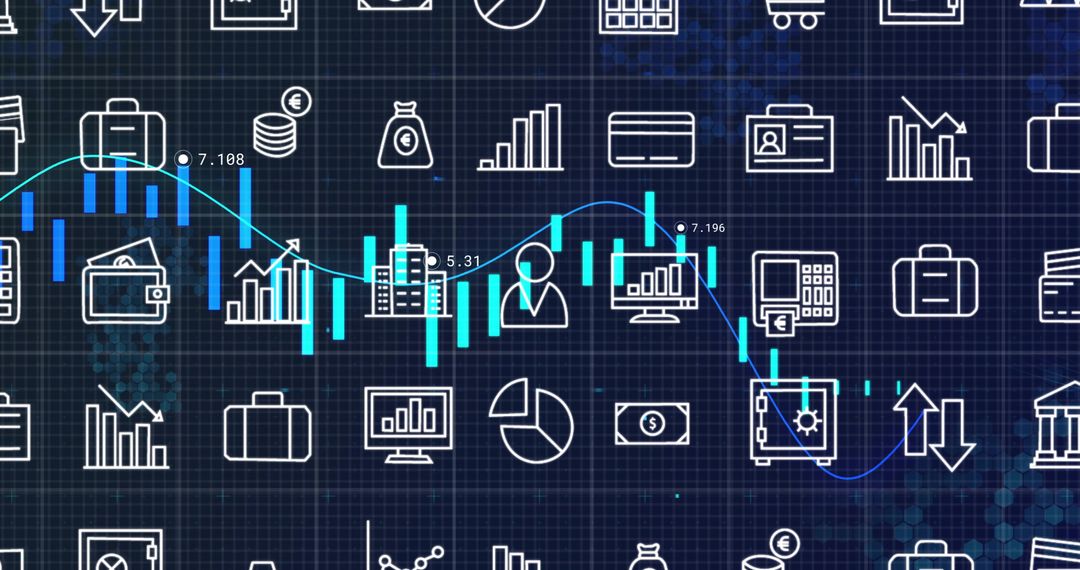
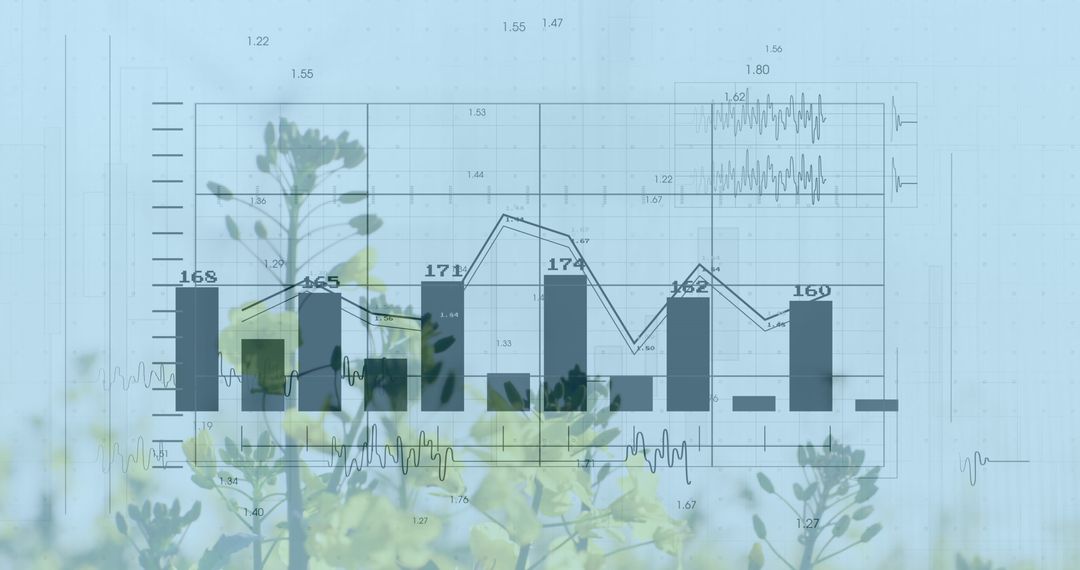
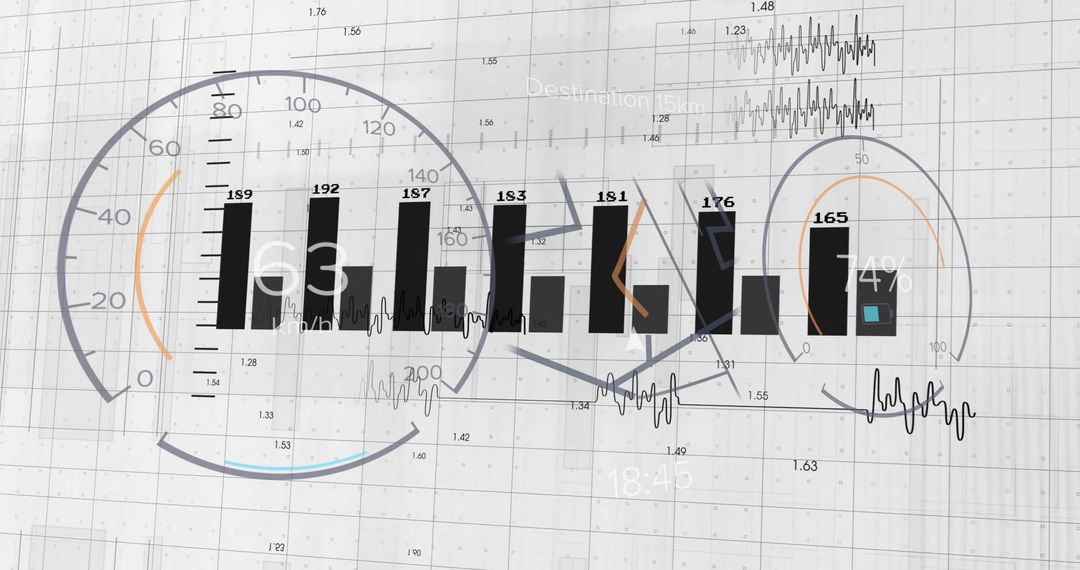
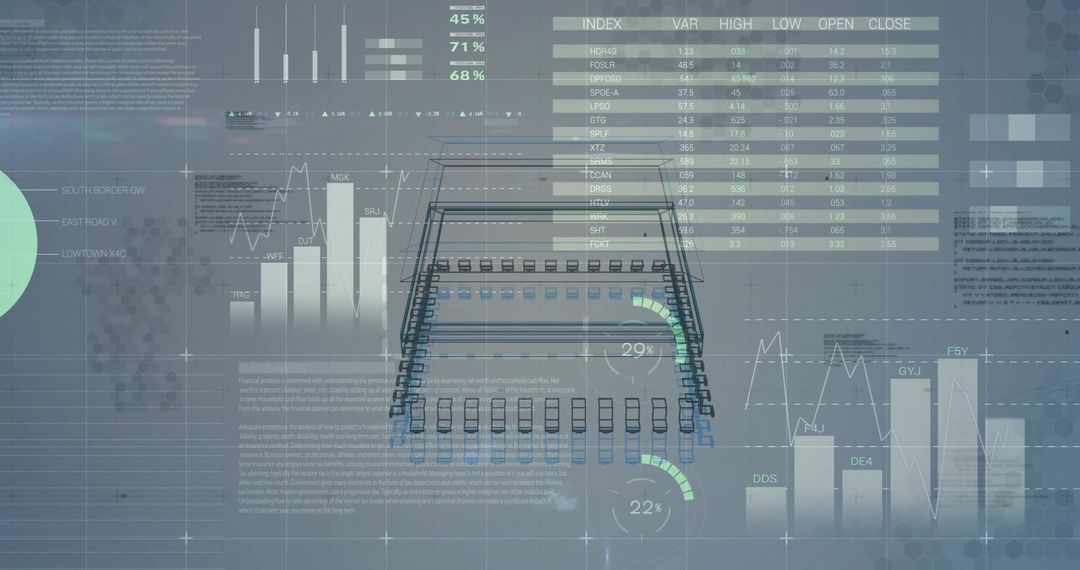
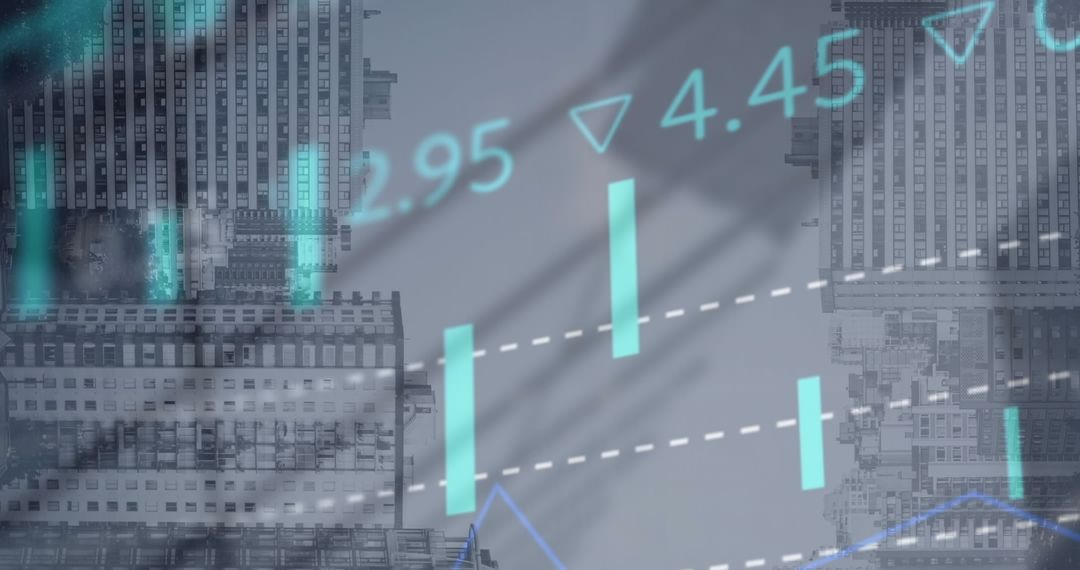
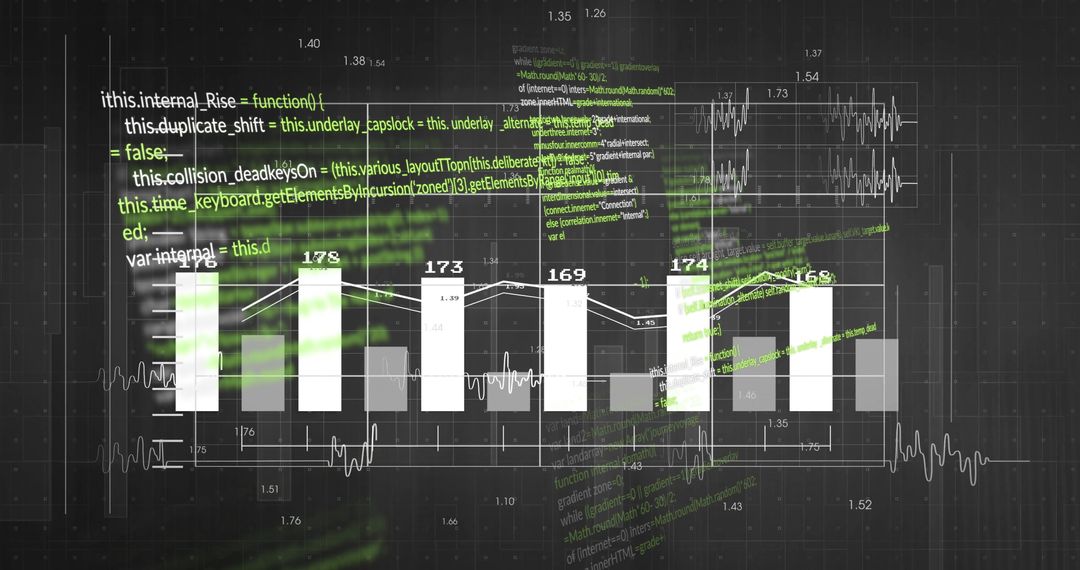
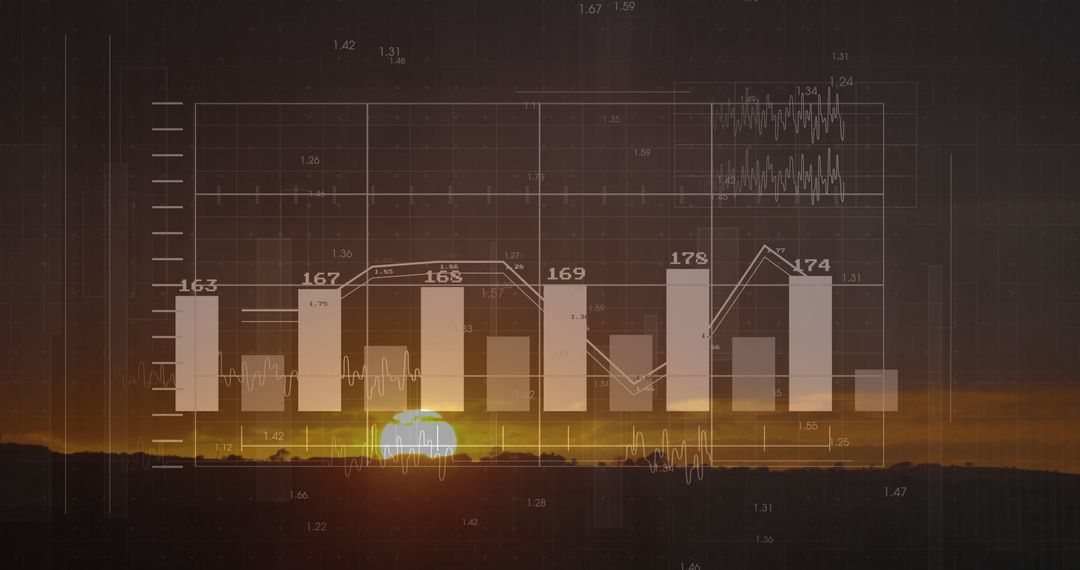
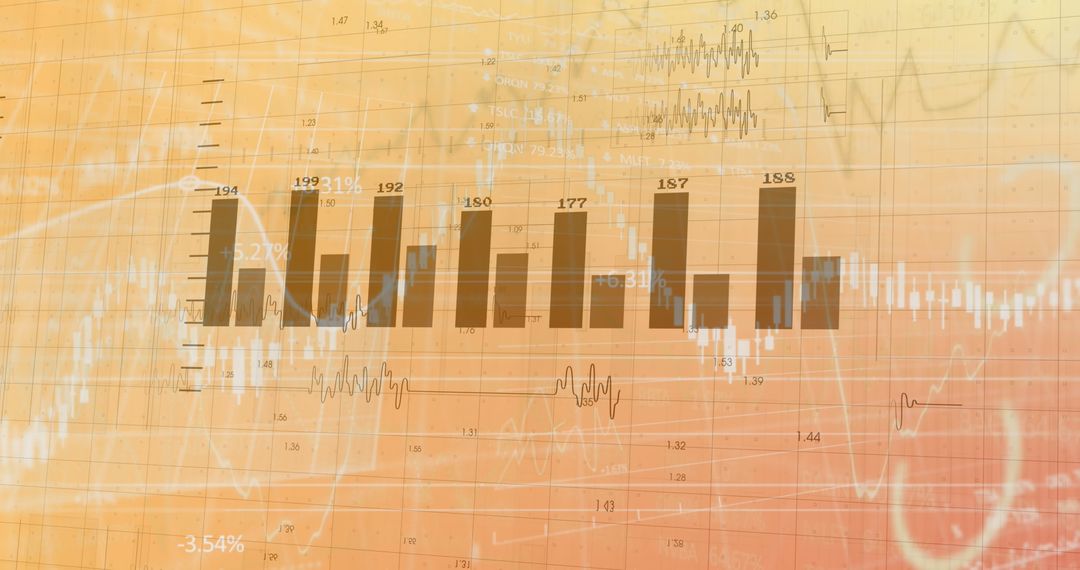
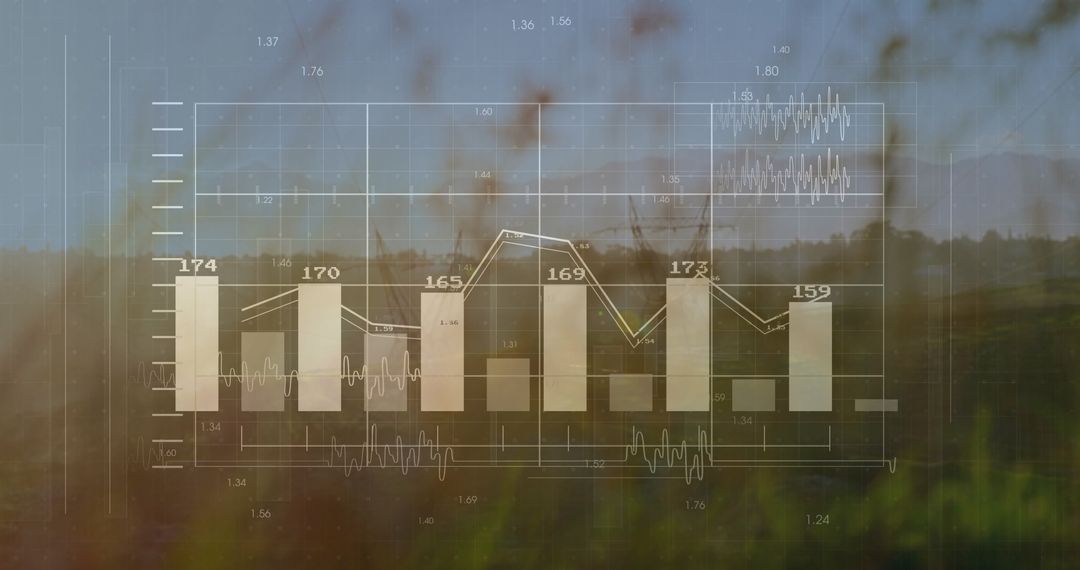
- Financial Data Dashboard with Analytics and Economics Symbols
Financial Data Dashboard with Analytics and Economics Symbols Image
Visual representing financial data blended with digital and economic elements, such as bar charts and line graphs on a technologically-themed background. Key elements like waveforms and piggy bank icons indicate financial activity analysis, useful for presentations, financial service marketing, and software design mockups highlighting investment trends and technological impact in economics.
Powered by 


0
downloads
downloads
Tags:
More
Credit Photo
If you would like to credit the Photo, here are some ways you can do so
Text Link
photo Link
<span class="text-link">
<span>
<a target="_blank" href=https://pikwizard.com/photo/financial-data-dashboard-with-analytics-and-economics-symbols/09806aeefd40c32789d122096f5d1ef5/>PikWizard</a>
</span>
</span>
<span class="image-link">
<span
style="margin: 0 0 20px 0; display: inline-block; vertical-align: middle; width: 100%;"
>
<a
target="_blank"
href="https://pikwizard.com/photo/financial-data-dashboard-with-analytics-and-economics-symbols/09806aeefd40c32789d122096f5d1ef5/"
style="text-decoration: none; font-size: 10px; margin: 0;"
>
<img src="https://pikwizard.com/pw/medium/09806aeefd40c32789d122096f5d1ef5.jpg" style="margin: 0; width: 100%;" alt="" />
<p style="font-size: 12px; margin: 0;">PikWizard</p>
</a>
</span>
</span>
Free (free of charge)
Free for personal and commercial use.
Author: People Creations
Similar Free Stock Images

Premium


Premium


Premium


Premium


Premium


Premium


Premium


Premium


Premium


Premium


Premium


Premium


Premium


Premium


Premium


Premium


Premium


Premium


Premium


Premium


Premium


Premium


Premium


Premium