
- Home >
- Stock Photos >
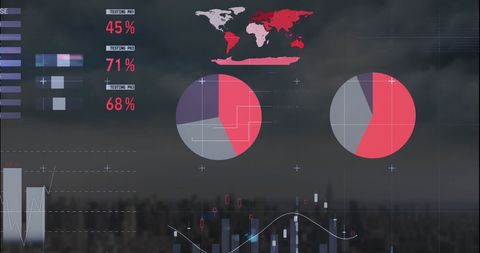
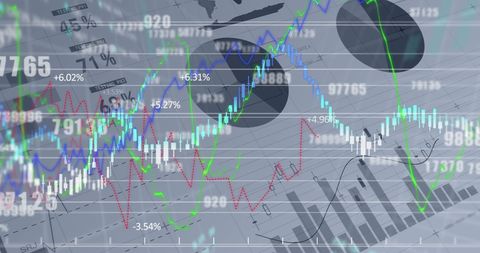
- Financial Data Dashboard with Global Infographic Elements
Financial Data Dashboard with Global Infographic Elements Image

Complex digital interface displaying financial analytics through global offsets with charts and graphical statistics. Suitable for presentations, corporate reports, financial software demonstrations, and educational materials on data visualization in business contexts.
Powered by 


downloads
Tags:
More
Credit Photo
If you would like to credit the Photo, here are some ways you can do so
Text Link
photo Link
<span class="text-link">
<span>
<a target="_blank" href=https://pikwizard.com/photo/financial-data-dashboard-with-global-infographic-elements/e8b45d2866bf44c58e71c010745b17d8/>PikWizard</a>
</span>
</span>
<span class="image-link">
<span
style="margin: 0 0 20px 0; display: inline-block; vertical-align: middle; width: 100%;"
>
<a
target="_blank"
href="https://pikwizard.com/photo/financial-data-dashboard-with-global-infographic-elements/e8b45d2866bf44c58e71c010745b17d8/"
style="text-decoration: none; font-size: 10px; margin: 0;"
>
<img src="https://pikwizard.com/pw/medium/e8b45d2866bf44c58e71c010745b17d8.jpg" style="margin: 0; width: 100%;" alt="" />
<p style="font-size: 12px; margin: 0;">PikWizard</p>
</a>
</span>
</span>
Free (free of charge)
Free for personal and commercial use.
Author: People Creations
Similar Free Stock Images

Premium


Premium

Premium


Premium


Premium


Premium


Premium


Premium


Premium


Premium


Premium


Premium


Premium


Premium

Premium
Premium


Premium


Premium


Premium


Premium


Premium


Premium


Premium


Premium


Premium

Explore More Free Stock Images