
- Home >
- Stock Photos >
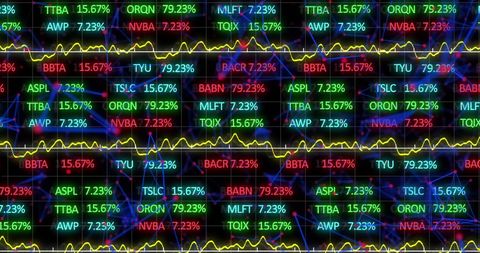
- Financial Data Display with Dynamic Chart on Blue Background
Financial Data Display with Dynamic Chart on Blue Background Image
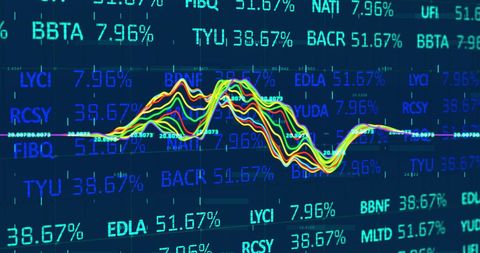
Dynamic financial data and colorful chart flowing against a blue backdrop, symbolizing economic trends. Perfect for illustrating stock market updates, financial analysis, or economic forecasting related content.
Powered by  - Get 15% off with code: PIKWIZARD15


downloads
Tags:
More
Credit Photo
If you would like to credit the Photo, here are some ways you can do so
Text Link
photo Link
<span class="text-link">
<span>
<a target="_blank" href=https://pikwizard.com/photo/financial-data-display-with-dynamic-chart-on-blue-background/fad1935b84d42c7e27d969de4eac79f3/>PikWizard</a>
</span>
</span>
<span class="image-link">
<span
style="margin: 0 0 20px 0; display: inline-block; vertical-align: middle; width: 100%;"
>
<a
target="_blank"
href="https://pikwizard.com/photo/financial-data-display-with-dynamic-chart-on-blue-background/fad1935b84d42c7e27d969de4eac79f3/"
style="text-decoration: none; font-size: 10px; margin: 0;"
>
<img src="https://pikwizard.com/pw/medium/fad1935b84d42c7e27d969de4eac79f3.jpg" style="margin: 0; width: 100%;" alt="" />
<p style="font-size: 12px; margin: 0;">PikWizard</p>
</a>
</span>
</span>
Free (free of charge)
Free for personal and commercial use.
Author: People Creations
Similar Free Stock Images

Premium


Premium

Premium


Premium


Premium


Premium

Premium

Premium

Premium


Premium


Premium

Premium

Premium

Premium


Premium


Premium

Premium

Premium


Premium

Premium


Premium


Premium


Premium


Premium


Premium

Explore More Free Stock Images