1. Home > 
  2. Stock Photos > 
  3. Financial Data Display with Graphs and World Map

Financial Data Display with Graphs and World Map Image

Financial Data Display with Graphs and World Map

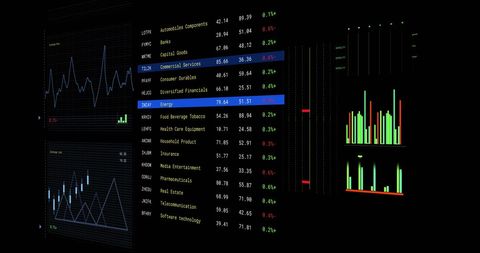
Modern digital design illustrating financial markets with graphs, statistical charts, and world map. Ideal for finance-related educational materials, business analysis, and digital media illustrating global economic trends. Useful for websites or reports focusing on data-driven insights in financial markets.

Powered by Shutterstock logo - Get 15% off with code: PIKWIZARD15
Using tablet pc, Consultant between bookkeepers and accounting lawyer consultation about asset, balance sheet, stock market statistics and yearly tax law, protect business from bribery. - Powered by Shutterstock - Get 15% off with code: PIKWIZARD15Analytical data and development statistics. Web analytics and product testing techniques are being measured. A guy studies an SEO dashboard and a digital report. - Powered by Shutterstock - Get 15% off with code: PIKWIZARD15Man look at the dashboard with graphs and charts. Concept of data management system, business intelligence, data statistics, marketing analysis, key performance indicators (KPI) and analytics. - Powered by Shutterstock - Get 15% off with code: PIKWIZARD15Man look at the dashboard with graphs and charts. Concept of data management system, business intelligence, data statistics, marketing analysis, key performance indicators (KPI) and analytics. - Powered by Shutterstock - Get 15% off with code: PIKWIZARD15Image of statistical and stock market data processing against view of tall buildings. Global economy and business data technology concept - Powered by Shutterstock - Get 15% off with code: PIKWIZARD15

Credit Photo

If you would like to credit the Photo, here are some ways you can do so

Free (free of charge)

Free for personal and commercial use.

Author: People Creations

Similar Free Stock Images

Digital Data Wave with Floating Numeric Values on Black Background
Premium
Woman Touching Screen Electronic Tablet Hand.Project Managers Researching Process.Business Team Working New Startup modern Office.International Digital Charts Interfaces.Analyze market stock.Blurred
Dynamic Digital Data Analysis on Elevated Grid
Digital Cardiograph on Black Background in Colorful Display
Vibrant Pink Cardio Wave on Digital Display
Financial Data Graph Rendering Global Market Trends
Premium
Risk Management Work process.Picture Trader working Market Report Document Touching Screen Tablet.Using Worldwide Graphic Icons,Stock Exchange Report.Business Project Startup.Horizontal,Flares Effect
Data Analytics and Financial Growth Indicators
Abstract Digital Blue Dot Graph with Floating Numbers
Optimized Statistical Data Overlain on Corporate Architecture
Abstract Digital Graph and Code on Violet Background
Premium
Businessman touching data analytics process system with KPI financial charts, dashboard of stock and marketing on virtual interface. With South Korea flag in background.
Social Media Activity Icons on Digital Graph
Digital Financial Data Analysis with Infographics and Charts
Digital Financial Data Overlay on Urban Street Scene
Abstract Digital Finance Chart Showing Fluctuating Graph Lines
Premium
Using tablet pc, Consultant between bookkeepers and accounting lawyer consultation about asset, balance sheet, stock market statistics and yearly tax law, protect business from bribery.
Analyzing Stock Market Data Trends with Futuristic Visuals
Digital Data Visualization with Trend Lines and Percentage Changes
Colorful Data Visualization on Dark Background
Dynamic Statistical Data Analysis on Digital Grid Network
Premium
3D blue bar graph rising, sotck market informations
Digital Data Flow with Infographics Hologram
NFT Financial Data Visualization with Digital Graph Overlay
Financial Data Analysis and Digital Interface Concept
Global Financial Data Processing with Abstract Graphs
Premium
Businessman touching data analytics process system with KPI financial charts, dashboard of stock and marketing on virtual interface. With Singapore flag in background.
Abstract Financial Data Processing and Analysis Interface
Digital Data Processing with Graph and Grid Technology Interface
Dynamic Stock Market Chart with Fluctuating Trends and Data Points
Digital Interface Visualizing DNA and Data Patterns
Digital Stock Market Graph with Floating Numeric Data
Financial Data Overlay on Cityscape Visualizing Market Trends
Premium
Man Typing Keyboard Laptop Hand.Project Manager Researching Process.Business Team Working Startup modern Office.Global Strategy Virtual Icon.Innovation Graphs Interfaces.Analyze market stock.Blurred
Colorful Digital ECG Heartbeat Graphs on Black Background
Digital Cardiograph Display with Heart Rate and SpO2 Monitors
Financial Data Flow against Urban Skyline Backdrop
Dynamic Green Stock Chart on Digital Grid Background
Premium
Business banking financial stock market concept. Businessman hand showing analyze financial data stock market. Business finance stock bar chart Hologram. Business success and growth
Financial Data Line Graph on Digital Display
Dynamic Stock Market Graph Displaying Surging Growth
Digital Financial Data Analysis with Graphs and Stock Market Trends
Digital Data Network with Dynamic Connections
Premium
Business banking financial stock market concept. Businessman hand showing analyze financial data stock market. Business finance stock bar chart Hologram. Business success and growth.
Dynamic Financial Growth Digital Chart Display
Financial Data Analysis with Declining Trends
Futuristic Digital Data Visualization on Blue Background
Digital Financial Data Processing with Glowing Indicators
Premium
Businessman touching data analytics process system with KPI financial charts, dashboard of stock and marketing on virtual interface. With Israel flag in background.
Data Analysis with Advanced Technology Interface Details Profusion
Colorful Bar Graph with Data Overlay on Black Background
Rising Financial Data Graph on Digital Grid Background
Digital Simulated Global Financial Data and Graphs
Premium
Photo team work process,holding contract hand,signs documents. Account managers young crew works with startup project.New idea presentation, analyze marketing reports. Blurred, film effect, horizontal
Dynamic Financial Chart with Upward Growth Arrow
Dynamic Financial Graphs Overlaying Modern Cityscape
Financial Data Analysis with Futuristic Technology Interface
Dynamic Financial Data Overlaid on Grid Background
Premium
Image of financial data processing over grid. Global business, finance, computing and data processing concept digitally generated image.
Financial Stock Market Data Visualization with Declining Trends
Global Cyber Security Data Interface on Dark Background
Futuristic Digital Representation of DNA Strand
Dynamic Financial Data Display in Digital Space
Digital Financial Data Overlaying City Skyline at Dusk
Digital Data Processing with Scope Scanning Interface
Premium
Image of stock market data processing against view of night city traffic. Global economy and business technology concept
Digital Heart Rate Monitor Interface Display
Data Recovery Progress Display on Digital Interface
Rising Digital Graph and Data Visualizations on Black Background
Digital Finance: Modern Stock Market Analysis Display
Premium
Rising glow arrows on white stairway as business chart steps on grid, blue background. Business economic and marketing growth graph process, higher goal, success, profit, financial investment concept.
Abstract Digital Interface for Medical Data Processing
Stagflation Concept with Fluctuating Financial Graph and Data
Analyzing Data Trends on Digital Graph Interface
Financial Data Processing with Digital Patterns for Global Business
Premium
Business banking financial stock market concept. Businessman hand showing analyze financial data stock market. Business finance stock bar chart Hologram. Business success and growth.
Data Analytics Graphs on Digital Interface Background
Dynamic Financial Data Visualizations on Grid Interface
Financial Data Analysis with Code Interface on Black Background
Dynamic Stock Market Analysis with Multicolored Statistics
Premium
Woman Touching Screen Electronic Tablet Hand.Project Managers Researching Process.Business Team Working New Startup modern Office.International Digital Diagrams Interfaces.Analyze market stock.Blurred
Sound Wave Visualization with Programming Code Elements
Data Visualization with Rising Red Arrow and Floating Numbers
Holographic Financial Data Visualization with Stock Trends
Financial Data Analysis Vibrant Graphs on Blue Background
Premium
Businessman use artificial intelligence AI technology analyzing financial data stock market. AI learning and business. Document data management on network, cyber security, digital transformation
Cityscape with Digital Stock Market Graphs and Statistics
Dynamic Financial Data on Digital Screen
Digital Financial Data Analysis on Grid Framework
Futuristic Digital Data Analysis Interface Visualization
Premium
Businessman touching data analytics process system with KPI financial charts, dashboard of stock and marketing on virtual interface. With Finland flag in background.
Dynamic Graphic of Financial Data Displayed on Graph
Abstract Digital DNA Helix with Geometric Patterns and Nodes
Futuristic Digital Interface with DNA and Brain Diagrams
Financial Data Visualization with Cityscape Overlay
Glowing Blue Cardiograph on Black Background Interface
Digital Cardiograph Display with Green Line over Black Background
Premium
Image of stock market data processing over spinning globe against city street. Global economy and business technology concept
Falling Line Graph on Navy Background Illustrating Economic Decline
Futuristic Digital Interface with Spiraling Coding Patterns
Fluctuating Digital Stock Market Data Chart
Digital Financial Data with Graph and Grid Patterns
Premium
Business banking financial stock market concept. Businessman hand showing analyze financial data stock market. Business finance stock bar chart Hologram. Business success and growth
Data Trends and Analysis on 3D Digital Grid
Financial Graph Displayed Over City Skyline at Sunset
Futuristic Financial Data Visualization on Digital Interface
European Market Data Overlay with EU Flag and Financial Graphs
Premium
Photo working process.Finance trade manager showing reports screen.Young business crew work with startup project modern office.Desktop computers on table, presentation new idea.Film effect.Horizontal.
Digital Graph Representing Data Analysis and Technology
Dynamic Business Data and Cityscape Visualization
Digital Global Communication and Social Interactions Concepts
Financial Data Processing with Rising Graphs
Premium
business people analyze virtual graphic financial graph chart diagram on mobile laptop computer, digital technology, business strategy, stock market investment, business finance technology concept
Abstract Digital Charts with Social Media Metrics Rising
Data Visualization on Security Shield Interface for Cyber Security
Dynamic Financial Data Processing in Green Sphere
Analyzing Financial Data on Digital World Map Background
Premium
Image of stock market data processing over caucasian male health worker holding stethoscope. Medical healthcare and technology concept
Digital Data Processing Over Black Background with Green Code
Heartbeat Medical Data over Computer Screen BluePulse Digital Concept
Abstract Representation of Financial Data Processing
Dynamic Financial Data Displays Stock Market Trends
Premium
Risk Management Work process.Photo Trader working Market Report Documents Touching Screen Tablet.Using Graphic Icons,Stock Exchanges Reports. Business Project Startup. Horizontal, Flares Effect.
Digital Data Processing with Chart in Futuristic Interface