
- Home >
- Stock Photos >
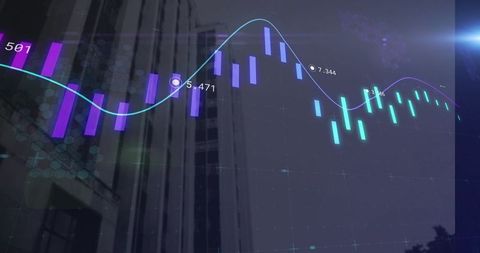
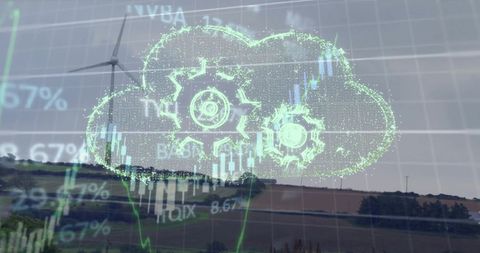
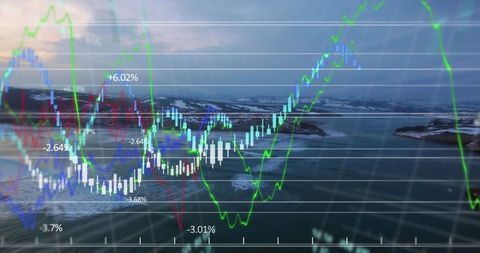
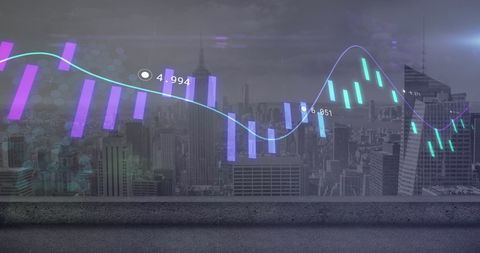
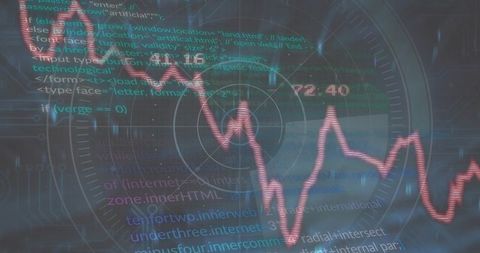
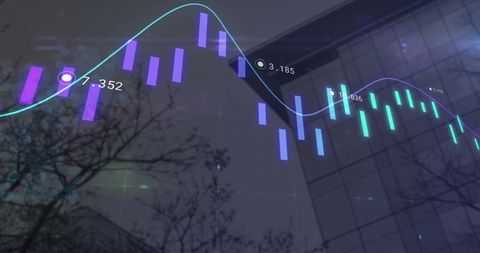
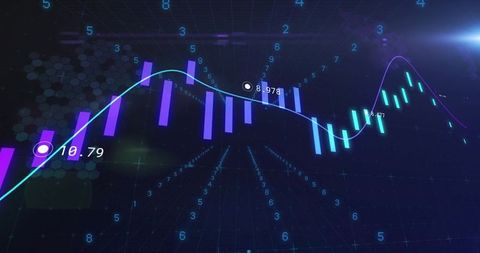
- Financial Data Fluctuating on Modern Digital Dashboard Interface
Financial Data Fluctuating on Modern Digital Dashboard Interface Image

Illustrating financial data trends with lines, arcs, and data labels on a digital dashboard. Suitable for technology presentations, data analytics blogs, investment pitches, and finance-related service advertisements. Highlights modern design and real-time data fluctuation.
Powered by 


downloads
Tags:
More
Credit Photo
If you would like to credit the Photo, here are some ways you can do so
Text Link
photo Link
<span class="text-link">
<span>
<a target="_blank" href=https://pikwizard.com/photo/financial-data-fluctuating-on-modern-digital-dashboard-interface/6fec797086120f267f8bc01a3c0d5409/>PikWizard</a>
</span>
</span>
<span class="image-link">
<span
style="margin: 0 0 20px 0; display: inline-block; vertical-align: middle; width: 100%;"
>
<a
target="_blank"
href="https://pikwizard.com/photo/financial-data-fluctuating-on-modern-digital-dashboard-interface/6fec797086120f267f8bc01a3c0d5409/"
style="text-decoration: none; font-size: 10px; margin: 0;"
>
<img src="https://pikwizard.com/pw/medium/6fec797086120f267f8bc01a3c0d5409.jpg" style="margin: 0; width: 100%;" alt="" />
<p style="font-size: 12px; margin: 0;">PikWizard</p>
</a>
</span>
</span>
Free (free of charge)
Free for personal and commercial use.
Author: Creative Art
Similar Free Stock Images

Premium


Premium

Premium


Premium

Premium


Premium


Premium


Premium


Premium


Premium


Premium

Premium


Premium


Premium


Premium


Premium


Premium


Premium


Premium


Premium


Premium


Premium


Premium


Premium

Premium


Explore More Free Stock Images