- Home >
- Stock Photos >
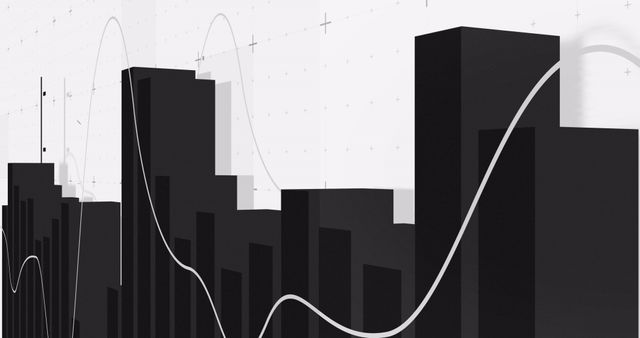
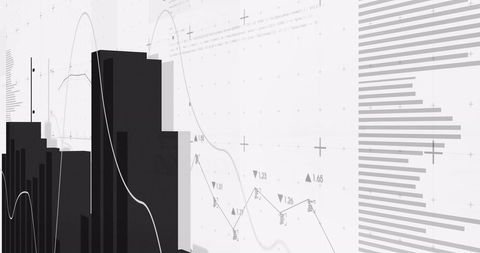
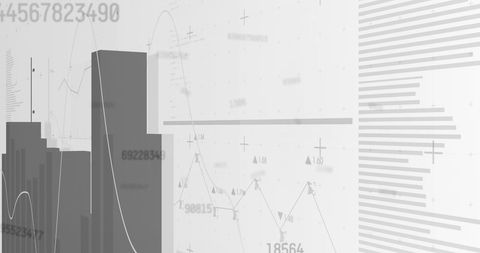
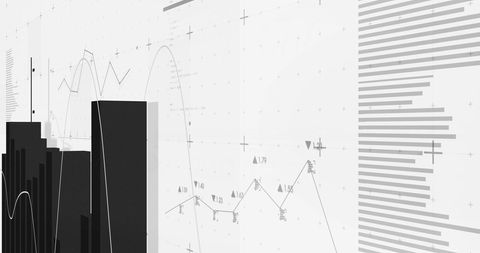
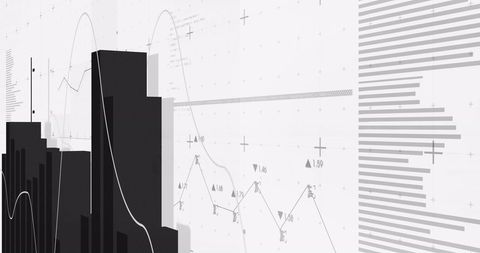
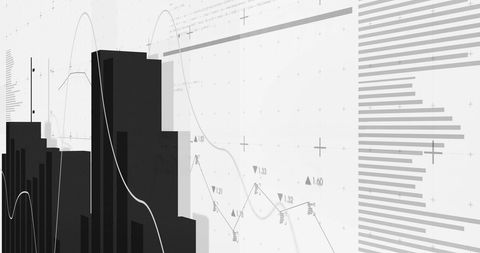
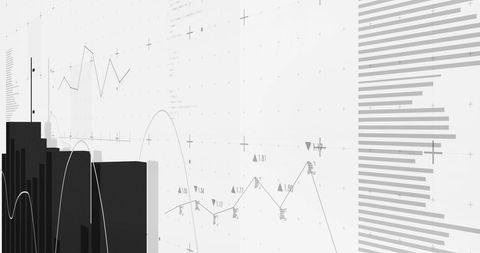
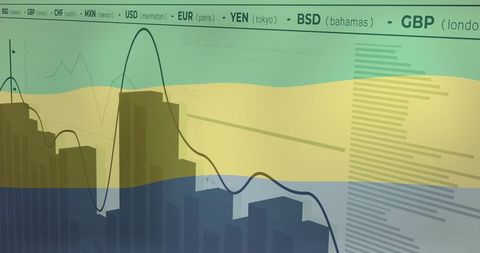
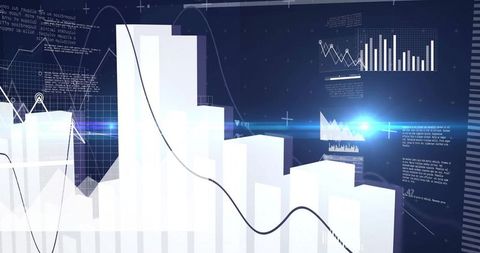
- Financial Data Graph and Analytics on Digital Screen
Financial Data Graph and Analytics on Digital Screen Image

Visual showcasing financial data analytics with charts and graphs on a blue digital backdrop. Useful for illustrating financial reports, business strategies, technology-driven changes, global market analysis, and digital transactions. Ideal for finance blogs, technology-based business presentations, or educational materials on economic insights.

downloads
Tags:
More
Credit Photo
If you would like to credit the Photo, here are some ways you can do so
Text Link
photo Link
<span class="text-link">
<span>
<a target="_blank" href=https://pikwizard.com/photo/financial-data-graph-and-analytics-on-digital-screen/be522e53519addd2682f641d43fdd493/>PikWizard</a>
</span>
</span>
<span class="image-link">
<span
style="margin: 0 0 20px 0; display: inline-block; vertical-align: middle; width: 100%;"
>
<a
target="_blank"
href="https://pikwizard.com/photo/financial-data-graph-and-analytics-on-digital-screen/be522e53519addd2682f641d43fdd493/"
style="text-decoration: none; font-size: 10px; margin: 0;"
>
<img src="https://pikwizard.com/pw/medium/be522e53519addd2682f641d43fdd493.jpg" style="margin: 0; width: 100%;" alt="" />
<p style="font-size: 12px; margin: 0;">PikWizard</p>
</a>
</span>
</span>
Free (free of charge)
Free for personal and commercial use.
Author: Creative Art