
- Home >
- Stock Photos >
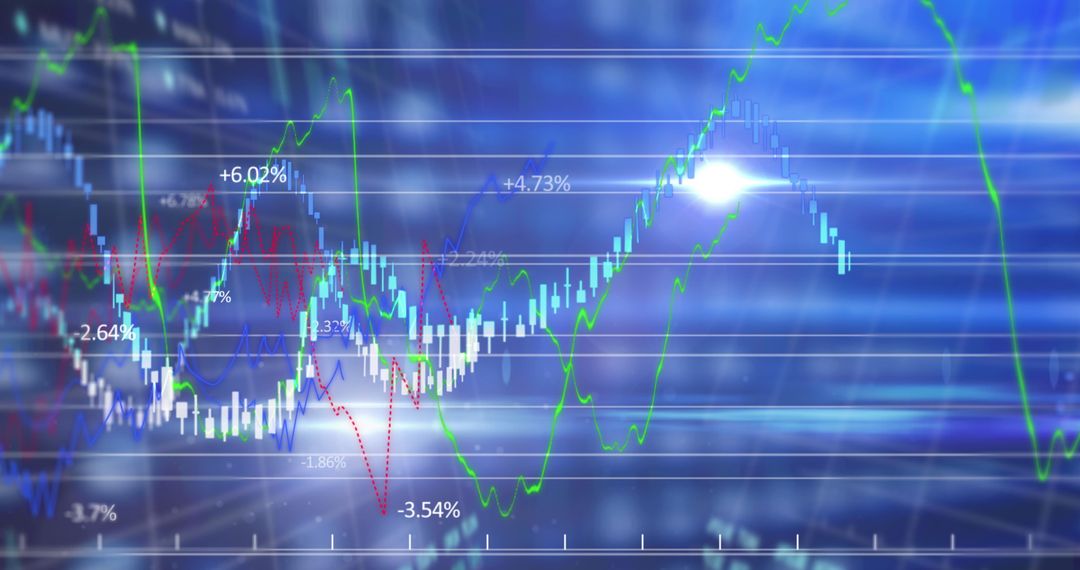
- Financial Data Graph Displaying Upward Trend on Blue Abstract Background
Financial Data Graph Displaying Upward Trend on Blue Abstract Background Image

Finance graph illustrates upward trend, conveying growth and analysis concept. Useful for presentations, articles on economic growth, investment opportunities. Blue abstract background gives technological, modern feel, making it suitable for digital media and industry reports.
Powered by  - Get 15% off with code: PIKWIZARD15


2
downloads
downloads
Tags:
More
Credit Photo
If you would like to credit the Photo, here are some ways you can do so
Text Link
photo Link
<span class="text-link">
<span>
<a target="_blank" href=https://pikwizard.com/photo/financial-data-graph-displaying-upward-trend-on-blue-abstract-background/c4f16eb03b6e5dc36f173a4bee31f54f/>PikWizard</a>
</span>
</span>
<span class="image-link">
<span
style="margin: 0 0 20px 0; display: inline-block; vertical-align: middle; width: 100%;"
>
<a
target="_blank"
href="https://pikwizard.com/photo/financial-data-graph-displaying-upward-trend-on-blue-abstract-background/c4f16eb03b6e5dc36f173a4bee31f54f/"
style="text-decoration: none; font-size: 10px; margin: 0;"
>
<img src="https://pikwizard.com/pw/medium/c4f16eb03b6e5dc36f173a4bee31f54f.jpg" style="margin: 0; width: 100%;" alt="" />
<p style="font-size: 12px; margin: 0;">PikWizard</p>
</a>
</span>
</span>
Free (free of charge)
Free for personal and commercial use.
Author: Creative Art
Similar Free Stock Images

Premium


Premium


Premium


Premium


Premium


Premium


Premium


Premium


Premium


Premium


Premium


Premium


Premium


Premium


Premium


Premium


Premium


Premium


Premium


Premium


Premium


Premium


Premium


Premium

