- Home >
- Stock Photos >
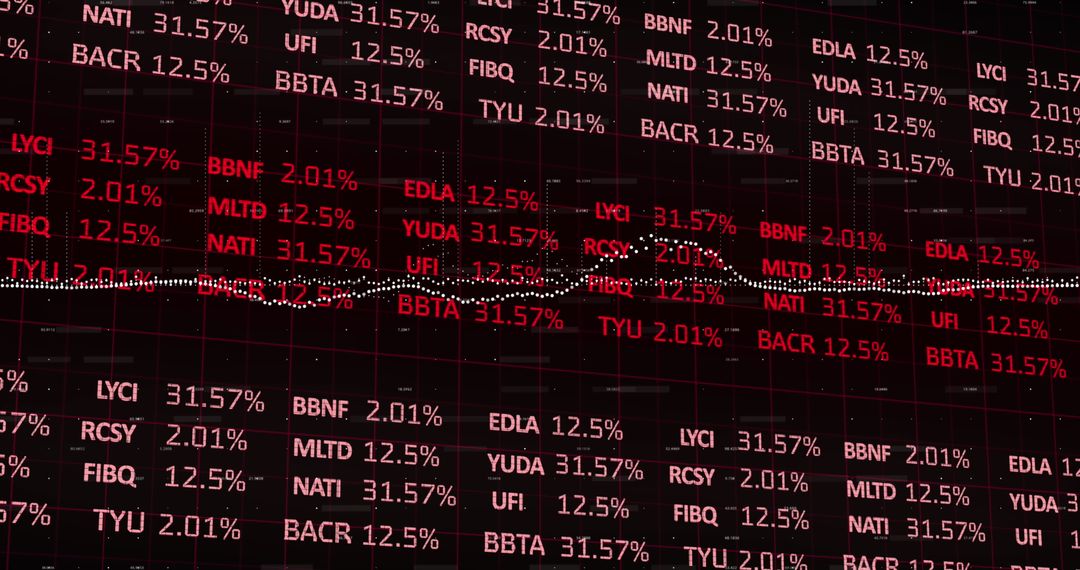
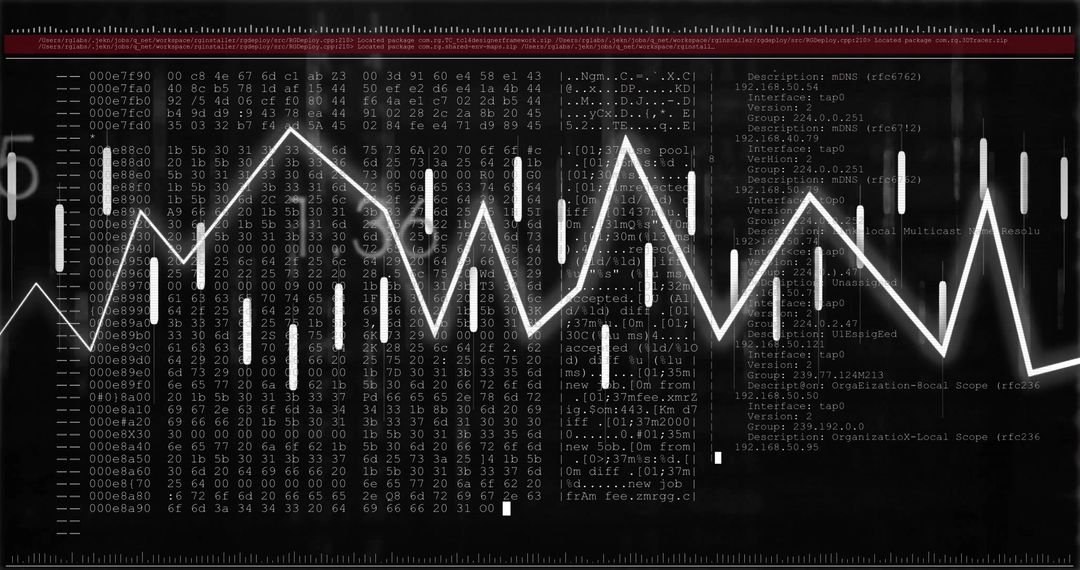
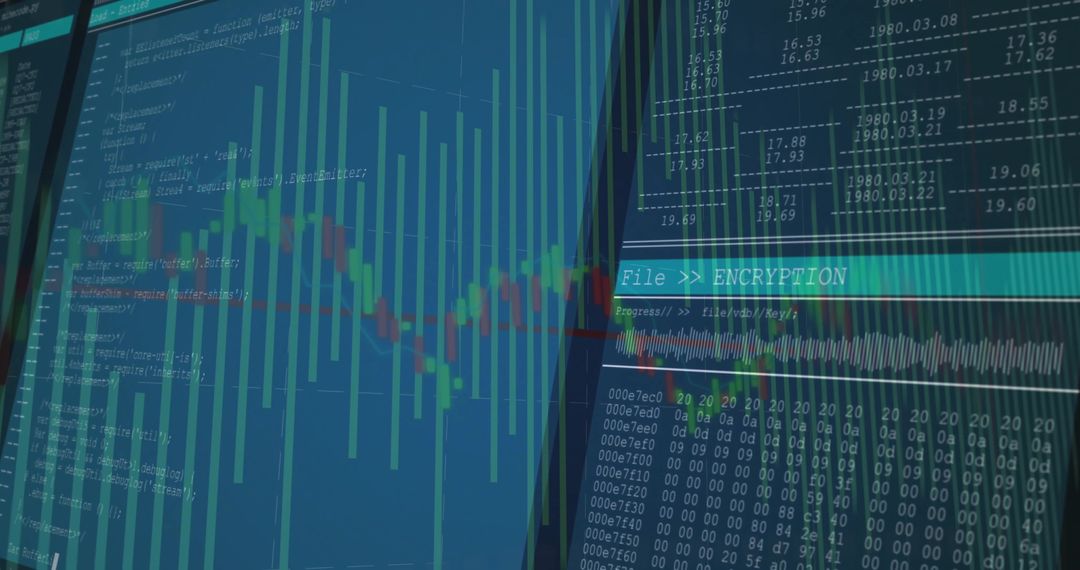
- Financial Data Graph on Digital Screen Displaying Market Trends
Financial Data Graph on Digital Screen Displaying Market Trends Image

Digital visualization of financial market data displaying trends and graphs on vibrant screen. Suitable for presentations on finance, market analysis, and technology advancements in data interpretation.
Powered by  - Get 15% off with code: PIKWIZARD15


2
downloads
downloads
Tags:
More
Credit Photo
If you would like to credit the Photo, here are some ways you can do so
Text Link
photo Link
<span class="text-link">
<span>
<a target="_blank" href=https://pikwizard.com/photo/financial-data-graph-on-digital-screen-displaying-market-trends/a6bc0a1b75ec21b9bd6e839d6f452c9f/>PikWizard</a>
</span>
</span>
<span class="image-link">
<span
style="margin: 0 0 20px 0; display: inline-block; vertical-align: middle; width: 100%;"
>
<a
target="_blank"
href="https://pikwizard.com/photo/financial-data-graph-on-digital-screen-displaying-market-trends/a6bc0a1b75ec21b9bd6e839d6f452c9f/"
style="text-decoration: none; font-size: 10px; margin: 0;"
>
<img src="https://pikwizard.com/pw/medium/a6bc0a1b75ec21b9bd6e839d6f452c9f.jpg" style="margin: 0; width: 100%;" alt="" />
<p style="font-size: 12px; margin: 0;">PikWizard</p>
</a>
</span>
</span>
Free (free of charge)
Free for personal and commercial use.
Author: Creative Art
Similar Free Stock Images

Premium


Premium


Premium


Premium


Premium


Premium


Premium


Premium


Premium


Premium


Premium


Premium


Premium


Premium


Premium


Premium


Premium


Premium


Premium


Premium


Premium


Premium


Premium


Premium