
- Home >
- Stock Photos >
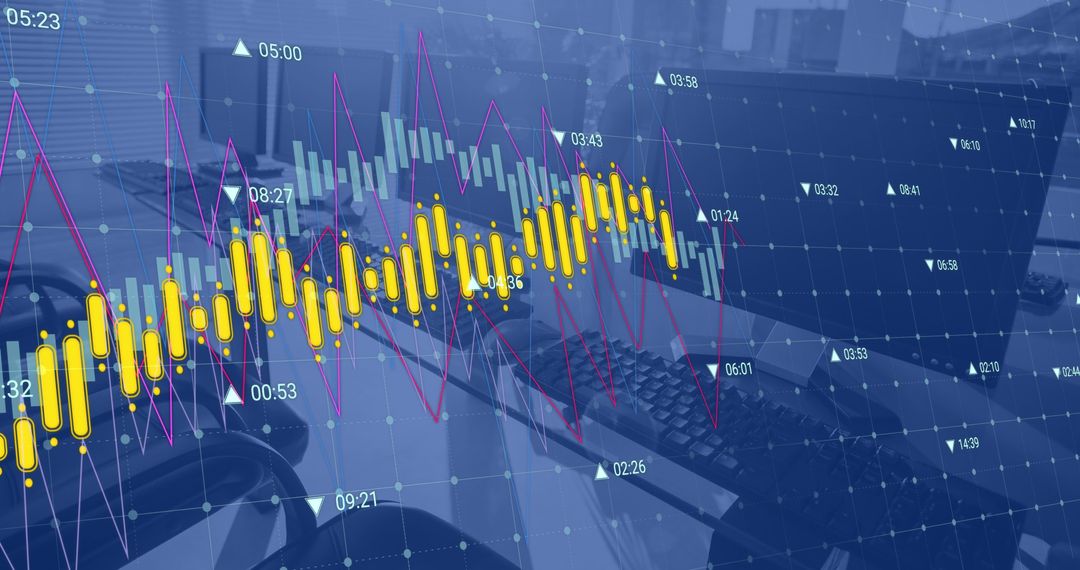
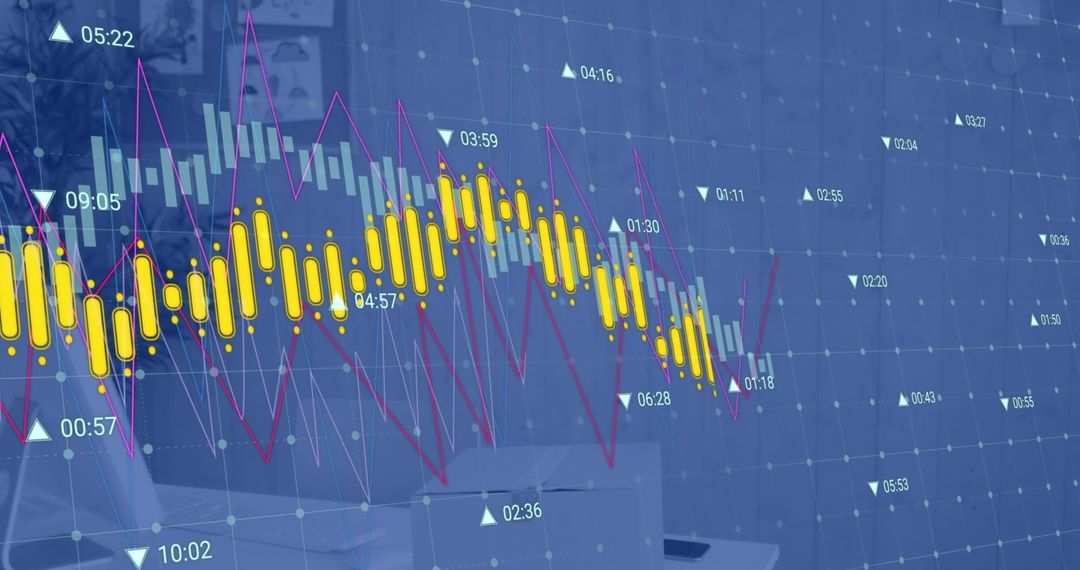
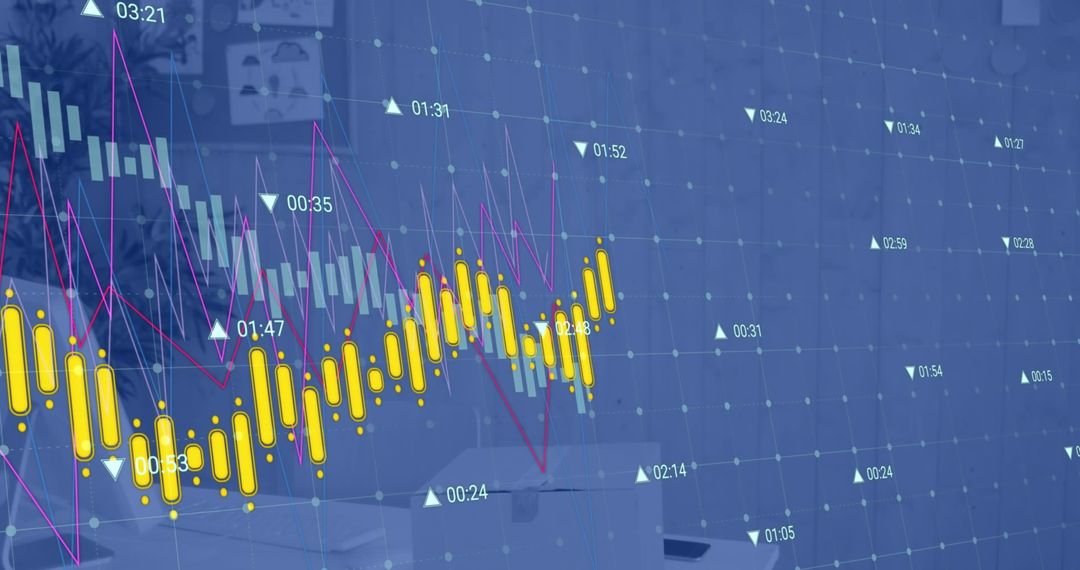
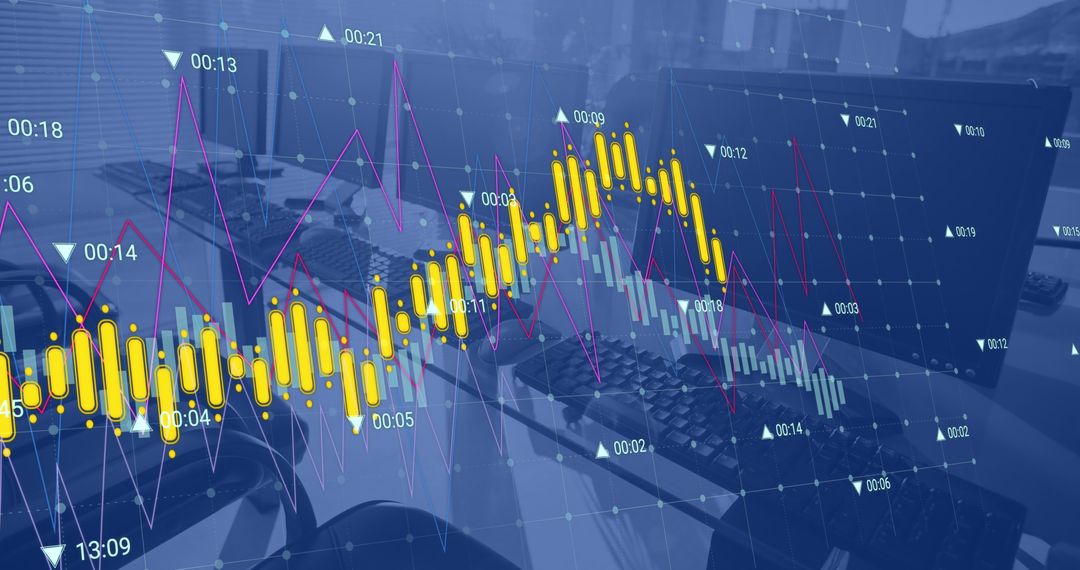
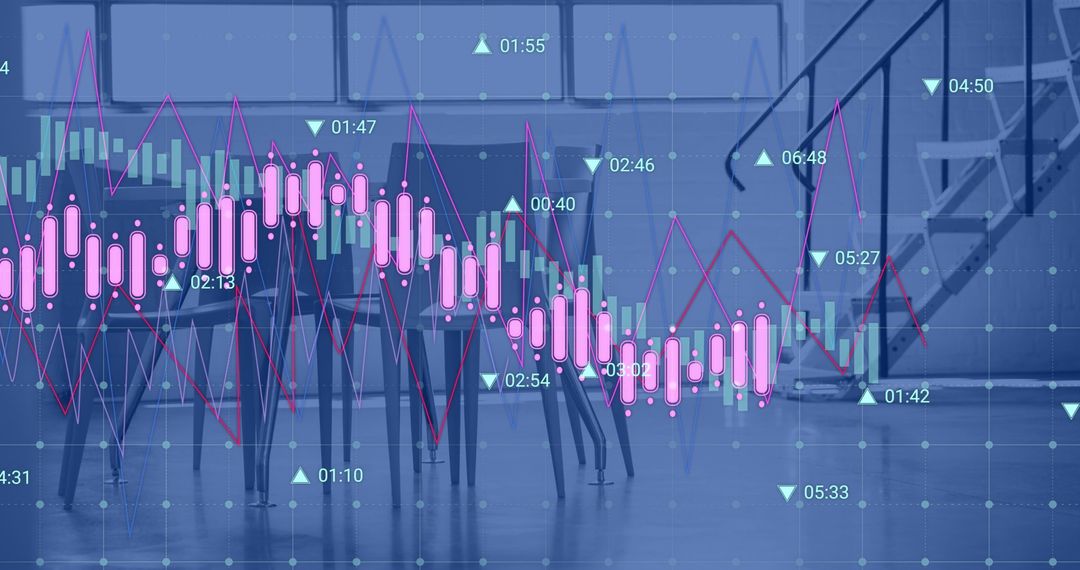
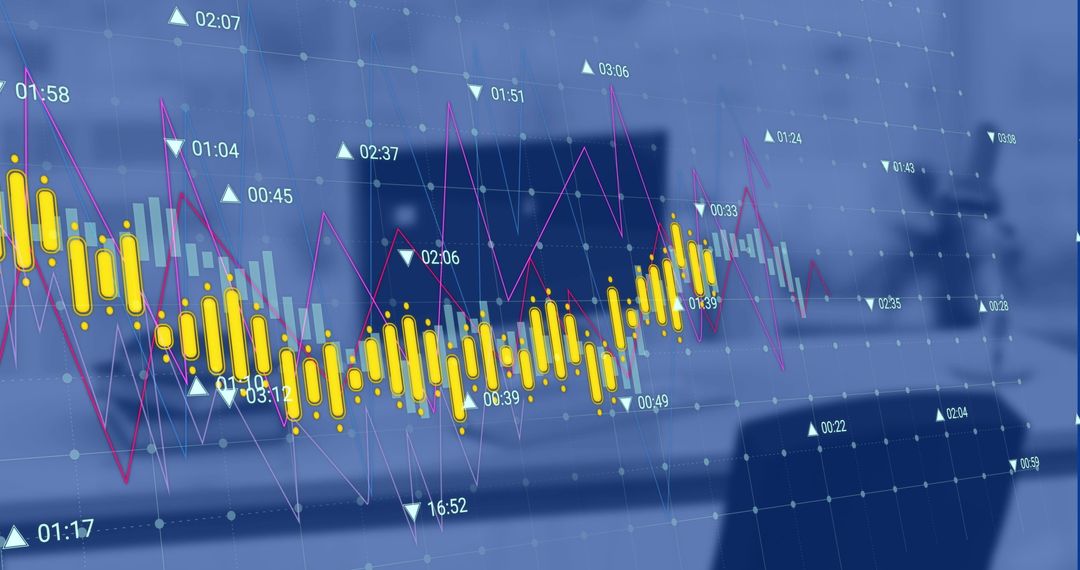
- Financial Data Graph Overlay in Modern Office Environment
Financial Data Graph Overlay in Modern Office Environment Image

Graphic illustration of financial data and stock market trends overlaid across a modern workspace. Arrows and various data points suggest fluctuation and analyses typical of stock markets. Perfect for use in financial presentations, business reports, technology forums and articles addressing economics or stock market updates.
Powered by  - Get 15% off with code: PIKWIZARD15


2
downloads
downloads
Tags:
More
Credit Photo
If you would like to credit the Photo, here are some ways you can do so
Text Link
photo Link
<span class="text-link">
<span>
<a target="_blank" href=https://pikwizard.com/photo/financial-data-graph-overlay-in-modern-office-environment/a106f5b532b693f255b30babf4ecd51c/>PikWizard</a>
</span>
</span>
<span class="image-link">
<span
style="margin: 0 0 20px 0; display: inline-block; vertical-align: middle; width: 100%;"
>
<a
target="_blank"
href="https://pikwizard.com/photo/financial-data-graph-overlay-in-modern-office-environment/a106f5b532b693f255b30babf4ecd51c/"
style="text-decoration: none; font-size: 10px; margin: 0;"
>
<img src="https://pikwizard.com/pw/medium/a106f5b532b693f255b30babf4ecd51c.jpg" style="margin: 0; width: 100%;" alt="" />
<p style="font-size: 12px; margin: 0;">PikWizard</p>
</a>
</span>
</span>
Free (free of charge)
Free for personal and commercial use.
Author: People Creations
Similar Free Stock Images

Premium


Premium


Premium


Premium


Premium


Premium


Premium


Premium


Premium


Premium


Premium


Premium


Premium


Premium


Premium


Premium


Premium


Premium


Premium


Premium


Premium


Premium


Premium


Premium

