- Home >
- Stock Photos >
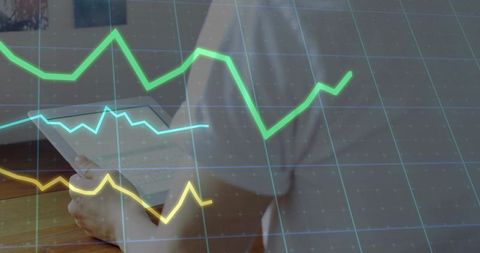
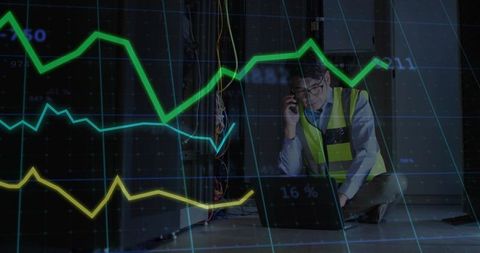
- Financial Data Graph Overlay on Modern Office Background
Financial Data Graph Overlay on Modern Office Background Image

Dynamic lines and graphial data are vibrant features on a composed office background, emphasizing financial analysis and modern technology. Beneficial for conveying themes of economics, business progress, data processing, and digital finance in presentations, educational materials, and corporate communications.
Powered by 


downloads
Tags:
More
Credit Photo
If you would like to credit the Photo, here are some ways you can do so
Text Link
photo Link
<span class="text-link">
<span>
<a target="_blank" href=https://pikwizard.com/photo/financial-data-graph-overlay-on-modern-office-background/4234b7070ea1a0d03066c861ebcd05c5/>PikWizard</a>
</span>
</span>
<span class="image-link">
<span
style="margin: 0 0 20px 0; display: inline-block; vertical-align: middle; width: 100%;"
>
<a
target="_blank"
href="https://pikwizard.com/photo/financial-data-graph-overlay-on-modern-office-background/4234b7070ea1a0d03066c861ebcd05c5/"
style="text-decoration: none; font-size: 10px; margin: 0;"
>
<img src="https://pikwizard.com/pw/medium/4234b7070ea1a0d03066c861ebcd05c5.jpg" style="margin: 0; width: 100%;" alt="" />
<p style="font-size: 12px; margin: 0;">PikWizard</p>
</a>
</span>
</span>
Free (free of charge)
Free for personal and commercial use.
Author: Creative Art
Similar Free Stock Images
Loading...

Premium


Premium


Premium

Premium


Premium

Premium


Premium

Premium


Premium


Premium


Premium

Premium


Premium


Premium


Premium


Premium


Premium


Premium


Premium


Premium


Premium


Premium


Premium

Premium


Premium