- Home >
- Stock Photos >
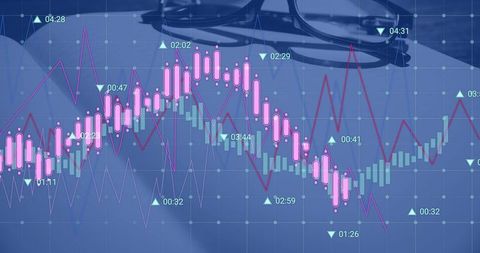
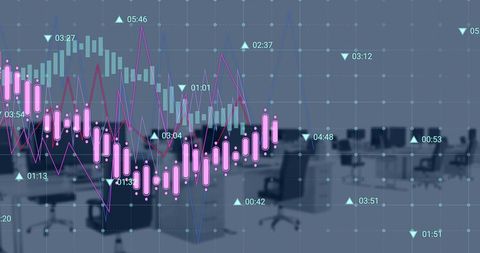
- Financial Data Graph with Digital Elements and Growth Indicators
Financial Data Graph with Digital Elements and Growth Indicators Image

Flow lines and digital elements create abstract representation of financial graph with trend indicators, symbolizing analysis and investment. Suitable for depicting themes in business analytics, market growth, company assessment presentations, and financial news articles.

downloads
Tags:
More
Credit Photo
If you would like to credit the Photo, here are some ways you can do so
Text Link
photo Link
<span class="text-link">
<span>
<a target="_blank" href=https://pikwizard.com/photo/financial-data-graph-with-digital-elements-and-growth-indicators/10187f39052ba6347421ceb5b81e5ae9/>PikWizard</a>
</span>
</span>
<span class="image-link">
<span
style="margin: 0 0 20px 0; display: inline-block; vertical-align: middle; width: 100%;"
>
<a
target="_blank"
href="https://pikwizard.com/photo/financial-data-graph-with-digital-elements-and-growth-indicators/10187f39052ba6347421ceb5b81e5ae9/"
style="text-decoration: none; font-size: 10px; margin: 0;"
>
<img src="https://pikwizard.com/pw/medium/10187f39052ba6347421ceb5b81e5ae9.jpg" style="margin: 0; width: 100%;" alt="" />
<p style="font-size: 12px; margin: 0;">PikWizard</p>
</a>
</span>
</span>
Free (free of charge)
Free for personal and commercial use.
Author: Awesome Content