- Home >
- Stock Photos >
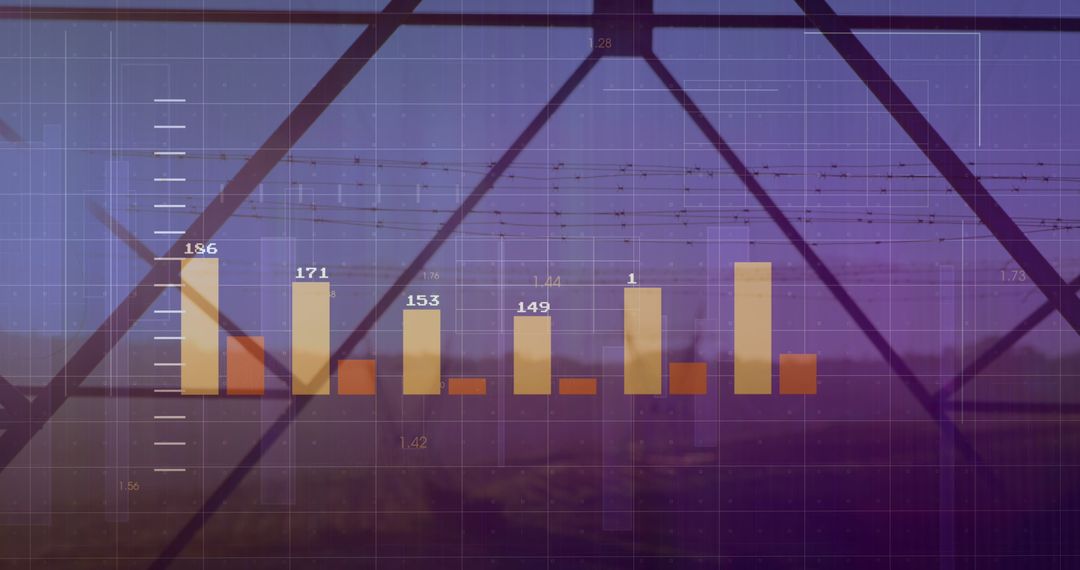
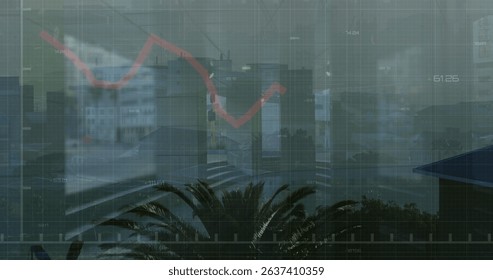
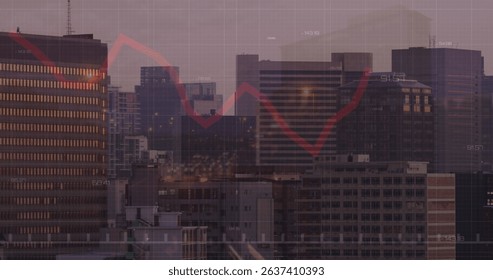
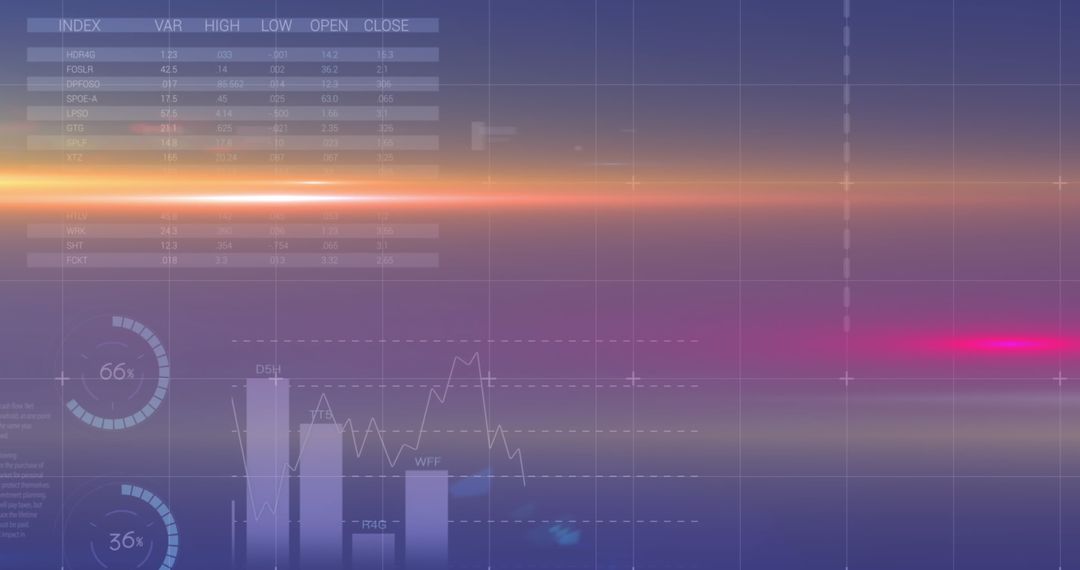
- Financial Data Graphics Overlay on Landscape at Night
Financial Data Graphics Overlay on Landscape at Night Image

Financial graphs and data bars overlayed on a dark, digital background, suggest connectivity and modern financial trends against the backdrop of an electrified landscape with pylons. Useful for illustrating concepts of global finance integration, business analytics, or technology-driven electricity management. Suitable for articles, presentations, and campaigns focusing on finance technology and modern business solutions.
Powered by  - Get 15% off with code: PIKWIZARD15


2
downloads
downloads
Tags:
More
Credit Photo
If you would like to credit the Photo, here are some ways you can do so
Text Link
photo Link
<span class="text-link">
<span>
<a target="_blank" href=https://pikwizard.com/photo/financial-data-graphics-overlay-on-landscape-at-night/73340f23e760c7f089739c8a35a18f35/>PikWizard</a>
</span>
</span>
<span class="image-link">
<span
style="margin: 0 0 20px 0; display: inline-block; vertical-align: middle; width: 100%;"
>
<a
target="_blank"
href="https://pikwizard.com/photo/financial-data-graphics-overlay-on-landscape-at-night/73340f23e760c7f089739c8a35a18f35/"
style="text-decoration: none; font-size: 10px; margin: 0;"
>
<img src="https://pikwizard.com/pw/medium/73340f23e760c7f089739c8a35a18f35.jpg" style="margin: 0; width: 100%;" alt="" />
<p style="font-size: 12px; margin: 0;">PikWizard</p>
</a>
</span>
</span>
Free (free of charge)
Free for personal and commercial use.
Author: Creative Art
Similar Free Stock Images

Premium


Premium


Premium


Premium


Premium


Premium


Premium


Premium


Premium


Premium


Premium


Premium


Premium


Premium


Premium


Premium


Premium


Premium


Premium


Premium


Premium


Premium


Premium


Premium