- Home >
- Stock Photos >
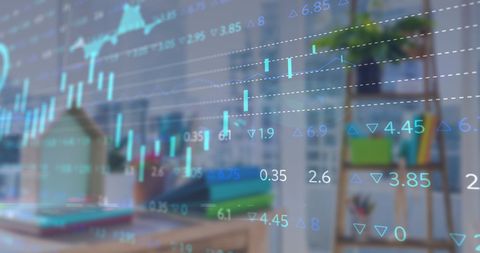
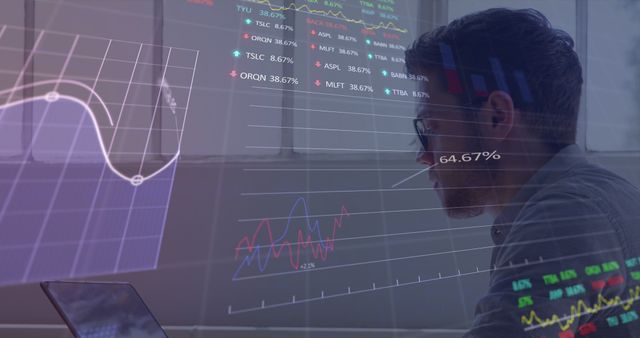
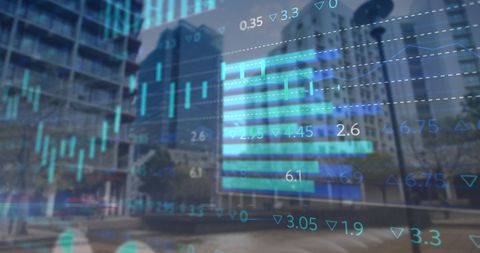
- Financial Data Graphs Displayed Over Modern Office Interior
Financial Data Graphs Displayed Over Modern Office Interior Image
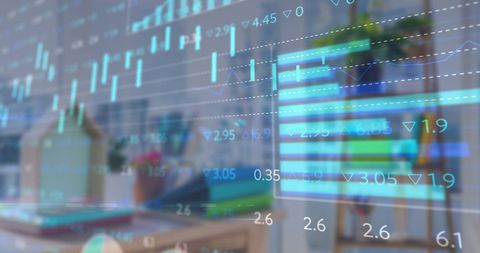
Blurred office backdrop with layered financial graphs and data visualizations creates a modern and professional feel. This is ideal for articles and websites focused on business analytics, stock market analysis, financial reports, and economic conditions.

downloads
Tags:
More
Credit Photo
If you would like to credit the Photo, here are some ways you can do so
Text Link
photo Link
<span class="text-link">
<span>
<a target="_blank" href=https://pikwizard.com/photo/financial-data-graphs-displayed-over-modern-office-interior/f2b4a3ac3e0817cea791cd3788bf3626/>PikWizard</a>
</span>
</span>
<span class="image-link">
<span
style="margin: 0 0 20px 0; display: inline-block; vertical-align: middle; width: 100%;"
>
<a
target="_blank"
href="https://pikwizard.com/photo/financial-data-graphs-displayed-over-modern-office-interior/f2b4a3ac3e0817cea791cd3788bf3626/"
style="text-decoration: none; font-size: 10px; margin: 0;"
>
<img src="https://pikwizard.com/pw/medium/f2b4a3ac3e0817cea791cd3788bf3626.jpg" style="margin: 0; width: 100%;" alt="" />
<p style="font-size: 12px; margin: 0;">PikWizard</p>
</a>
</span>
</span>
Free (free of charge)
Free for personal and commercial use.
Author: Creative Art