
- Home >
- Stock Photos >
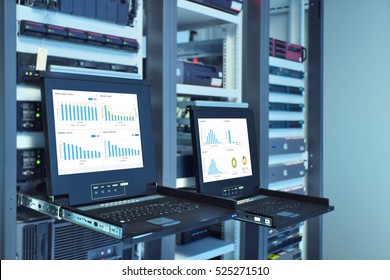
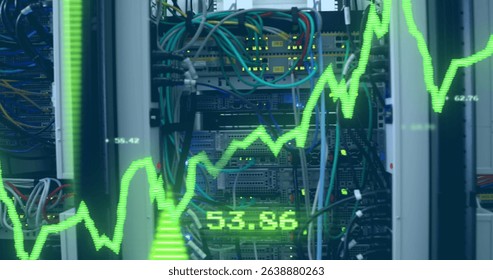
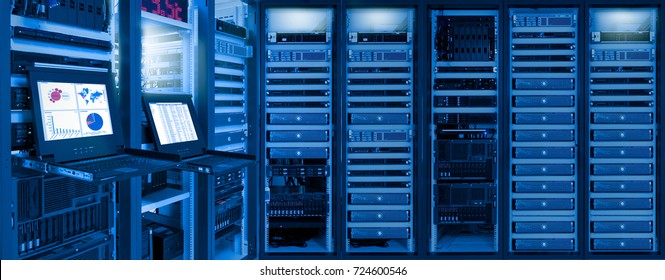
- Financial Data Graphs Overlaying Server Room for Business Analysis
Financial Data Graphs Overlaying Server Room for Business Analysis Image

Visual representation of data analysis and technology in business setting. Ideal for illustrating articles on financial markets, business intelligence, or data engineering. Useful for conveying the complexity of modern economic transactions and data infrastructure.
Powered by  - Get 15% off with code: PIKWIZARD15


2
downloads
downloads
Tags:
More
Credit Photo
If you would like to credit the Photo, here are some ways you can do so
Text Link
photo Link
<span class="text-link">
<span>
<a target="_blank" href=https://pikwizard.com/photo/financial-data-graphs-overlaying-server-room-for-business-analysis/c00e6442540fbfcdceaa90e5b0a74aca/>PikWizard</a>
</span>
</span>
<span class="image-link">
<span
style="margin: 0 0 20px 0; display: inline-block; vertical-align: middle; width: 100%;"
>
<a
target="_blank"
href="https://pikwizard.com/photo/financial-data-graphs-overlaying-server-room-for-business-analysis/c00e6442540fbfcdceaa90e5b0a74aca/"
style="text-decoration: none; font-size: 10px; margin: 0;"
>
<img src="https://pikwizard.com/pw/medium/c00e6442540fbfcdceaa90e5b0a74aca.jpg" style="margin: 0; width: 100%;" alt="" />
<p style="font-size: 12px; margin: 0;">PikWizard</p>
</a>
</span>
</span>
Free (free of charge)
Free for personal and commercial use.
Author: Awesome Content
Similar Free Stock Images

Premium


Premium


Premium


Premium


Premium


Premium


Premium


Premium


Premium


Premium


Premium


Premium


Premium


Premium


Premium


Premium


Premium


Premium


Premium


Premium


Premium


Premium


Premium


Premium

