- Home >
- Stock Photos >
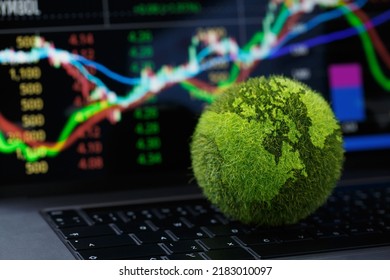
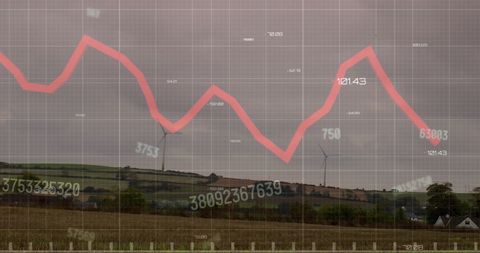
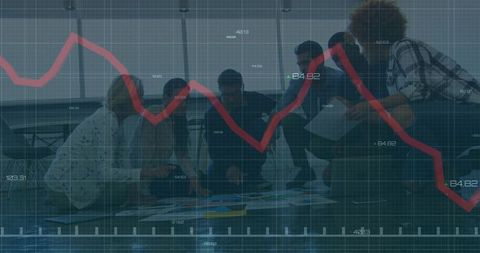
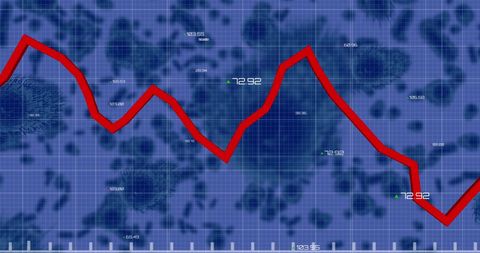
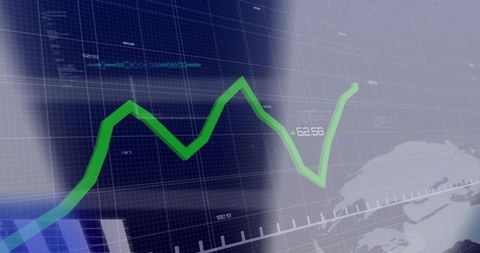
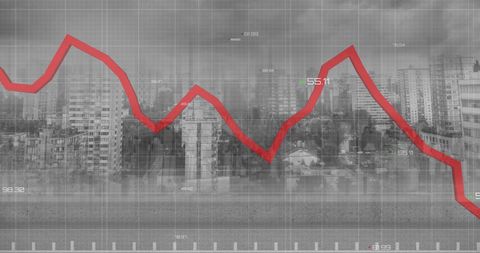
- Financial Data Integration with Agricultural and Environmental Landscapes
Financial Data Integration with Agricultural and Environmental Landscapes Image

Visually combines dynamic financial data graphs with agricultural fields, illustrating the intersection of economy, energy, and environment. Ideal for use in presentations or publications focusing on sustainable practices, global market analyses affecting agricultural industries, or integrating financial technologies with environmental considerations.
Powered by  - Get 15% off with code: PIKWIZARD15


2
downloads
downloads
Tags:
More
Credit Photo
If you would like to credit the Photo, here are some ways you can do so
Text Link
photo Link
<span class="text-link">
<span>
<a target="_blank" href=https://pikwizard.com/photo/financial-data-integration-with-agricultural-and-environmental-landscapes/b92a30978f7252646dc6a5deb296e6f9/>PikWizard</a>
</span>
</span>
<span class="image-link">
<span
style="margin: 0 0 20px 0; display: inline-block; vertical-align: middle; width: 100%;"
>
<a
target="_blank"
href="https://pikwizard.com/photo/financial-data-integration-with-agricultural-and-environmental-landscapes/b92a30978f7252646dc6a5deb296e6f9/"
style="text-decoration: none; font-size: 10px; margin: 0;"
>
<img src="https://pikwizard.com/pw/medium/b92a30978f7252646dc6a5deb296e6f9.jpg" style="margin: 0; width: 100%;" alt="" />
<p style="font-size: 12px; margin: 0;">PikWizard</p>
</a>
</span>
</span>
Free (free of charge)
Free for personal and commercial use.
Author: People Creations
Similar Free Stock Images
Loading...

Premium


Premium

Premium


Premium


Premium


Premium


Premium


Premium

Premium

Premium

Premium


Premium


Premium


Premium


Premium


Premium


Premium


Premium


Premium


Premium


Premium

Premium


Premium


Premium


Premium