
- Home >
- Stock Photos >
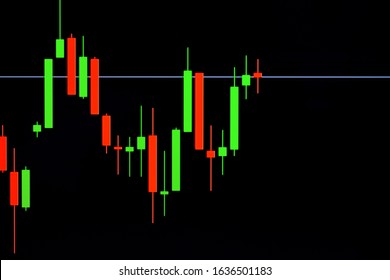
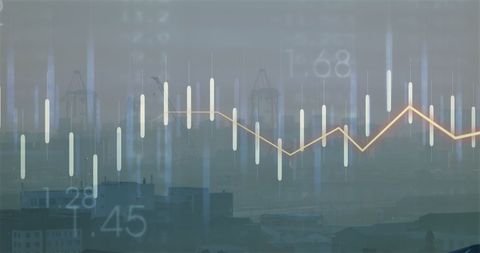
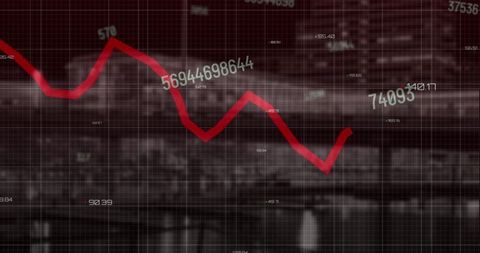
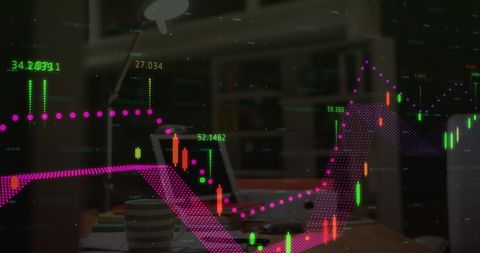
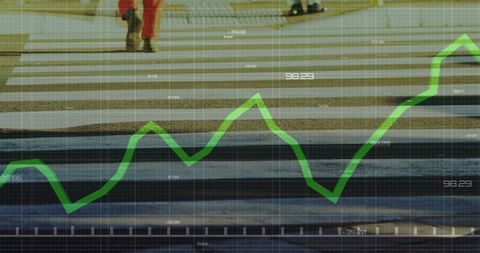
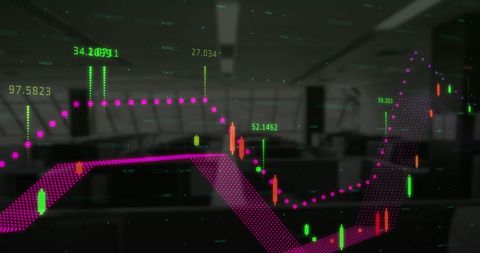
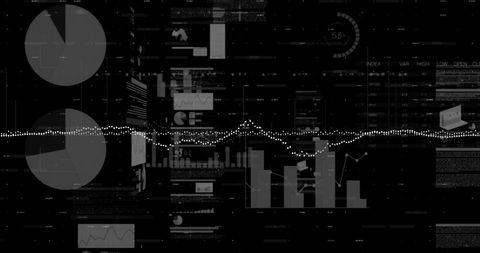
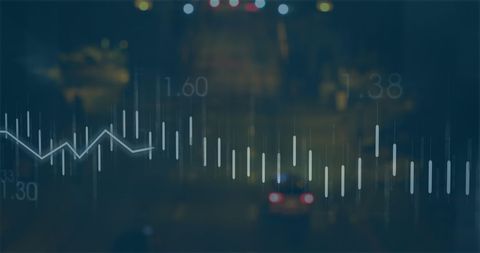
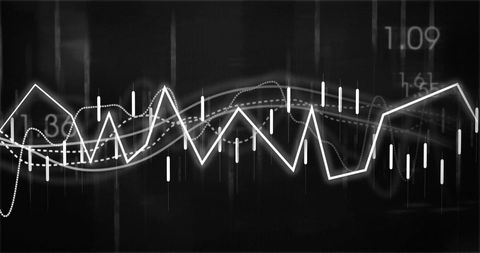
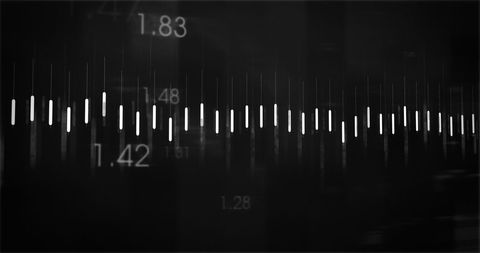
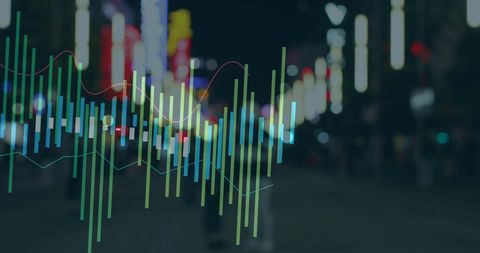
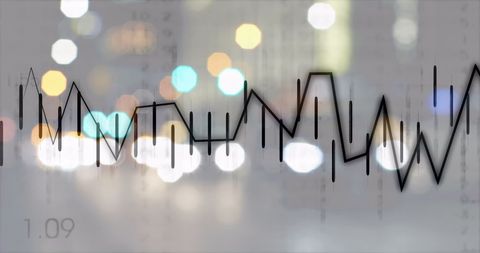
- Financial Data Interface with Candlesticks and Trend Line
Financial Data Interface with Candlesticks and Trend Line Image
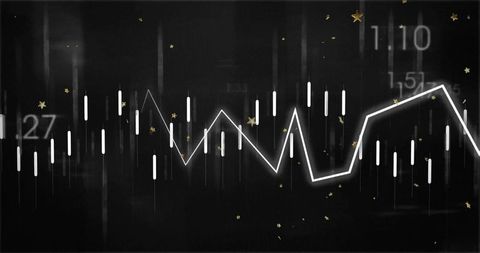
Displaying a digital display showcasing a zigzag trend line and candlestick bars within a dark interface, emphasized by numbers and gold stars. Ideal for illustrating concepts related to stock market analysis, financial predictions, and data-driven strategies. Useful in financial articles, analytics platforms, and presentations on business technology.
Powered by  - Get 15% off with code: PIKWIZARD15


downloads
Tags:
More
Credit Photo
If you would like to credit the Photo, here are some ways you can do so
Text Link
photo Link
<span class="text-link">
<span>
<a target="_blank" href=https://pikwizard.com/photo/financial-data-interface-with-candlesticks-and-trend-line/e38a7c414ca5ec957eb472989a9617c9/>PikWizard</a>
</span>
</span>
<span class="image-link">
<span
style="margin: 0 0 20px 0; display: inline-block; vertical-align: middle; width: 100%;"
>
<a
target="_blank"
href="https://pikwizard.com/photo/financial-data-interface-with-candlesticks-and-trend-line/e38a7c414ca5ec957eb472989a9617c9/"
style="text-decoration: none; font-size: 10px; margin: 0;"
>
<img src="https://pikwizard.com/pw/medium/e38a7c414ca5ec957eb472989a9617c9.jpg" style="margin: 0; width: 100%;" alt="" />
<p style="font-size: 12px; margin: 0;">PikWizard</p>
</a>
</span>
</span>
Free (free of charge)
Free for personal and commercial use.
Author: Awesome Content
Similar Free Stock Images
Premium


Premium
Premium


Premium


Premium


Premium


Premium

Premium


Premium


Premium

Premium

Premium


Premium


Premium


Premium

Premium

Premium


Premium


Premium

Premium


Premium


Premium


Premium

Premium

Premium


Explore More Free Stock Images