- Home >
- Stock Photos >
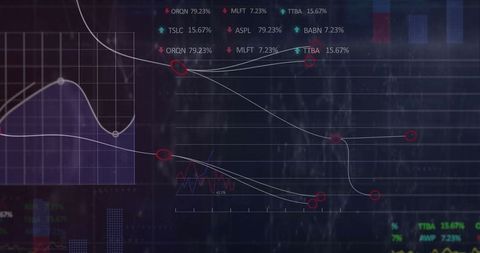
- Financial Data Interface with downtrending Red Line Graph for Analytics
Financial Data Interface with downtrending Red Line Graph for Analytics Image
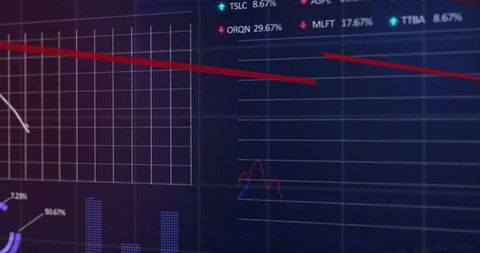
This abstract visualization depicts a financial trading dashboard featuring a distinctly downward trending red line against a white grid background. The presence of a legend with coded references indicates stocks or metrics relevant to current analytics. Use this for illustrating concepts in profit analytics, investment trends, or economic performance analysis in presentations, articles, or financial reports, helping to visually communicate complex data and technological interfaces.
Powered by  - Get 15% off with code: PIKWIZARD15


downloads
Tags:
More
Credit Photo
If you would like to credit the Photo, here are some ways you can do so
Text Link
photo Link
<span class="text-link">
<span>
<a target="_blank" href=https://pikwizard.com/photo/financial-data-interface-with-downtrending-red-line-graph-for-analytics/283be2dc6bbb39c6b487e59f6ffb6310/>PikWizard</a>
</span>
</span>
<span class="image-link">
<span
style="margin: 0 0 20px 0; display: inline-block; vertical-align: middle; width: 100%;"
>
<a
target="_blank"
href="https://pikwizard.com/photo/financial-data-interface-with-downtrending-red-line-graph-for-analytics/283be2dc6bbb39c6b487e59f6ffb6310/"
style="text-decoration: none; font-size: 10px; margin: 0;"
>
<img src="https://pikwizard.com/pw/medium/283be2dc6bbb39c6b487e59f6ffb6310.jpg" style="margin: 0; width: 100%;" alt="" />
<p style="font-size: 12px; margin: 0;">PikWizard</p>
</a>
</span>
</span>
Free (free of charge)
Free for personal and commercial use.
Author: Creative Art