
- Home >
- Stock Photos >
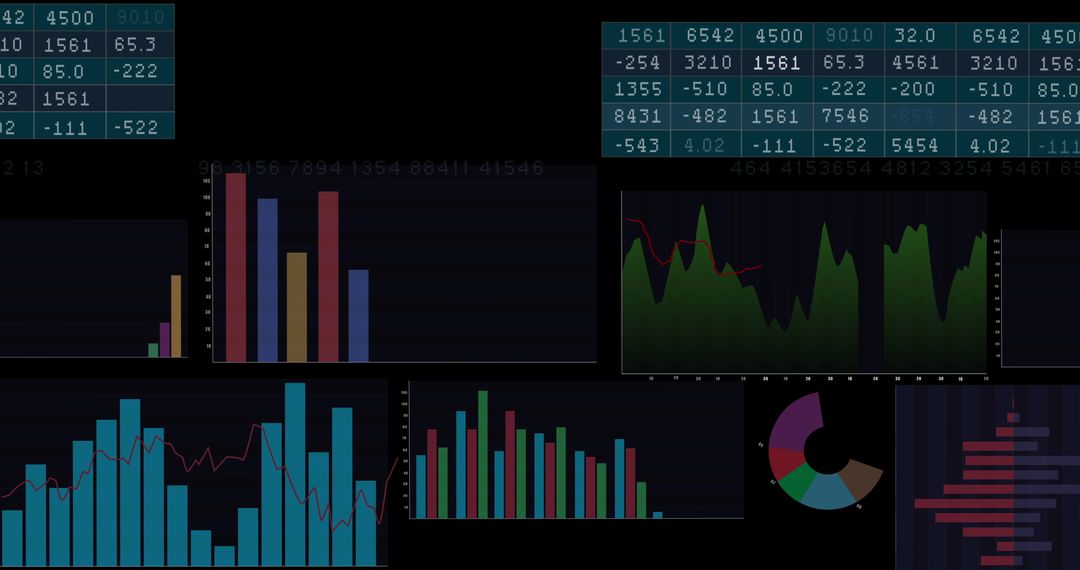
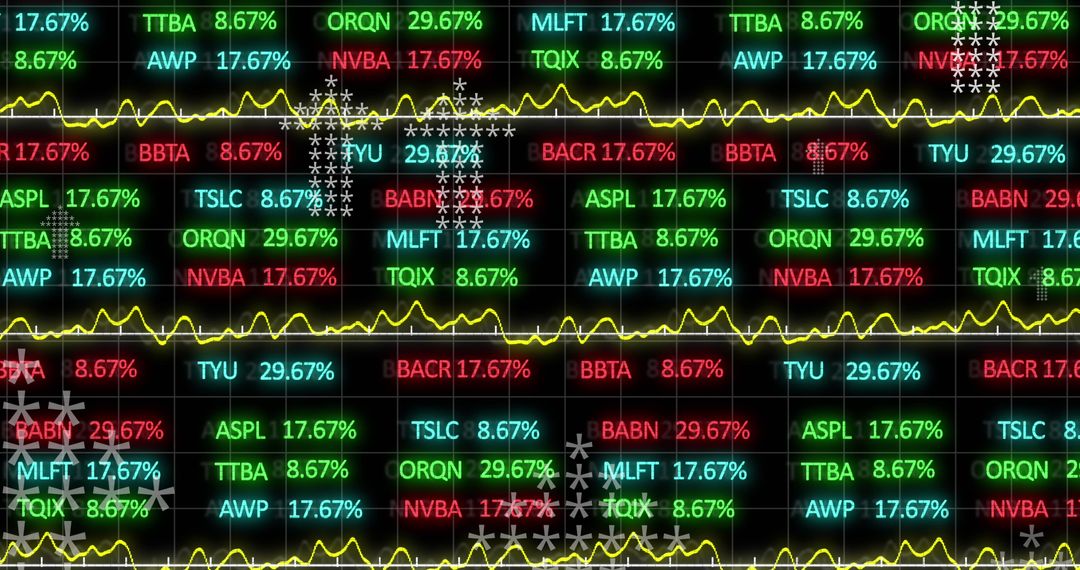
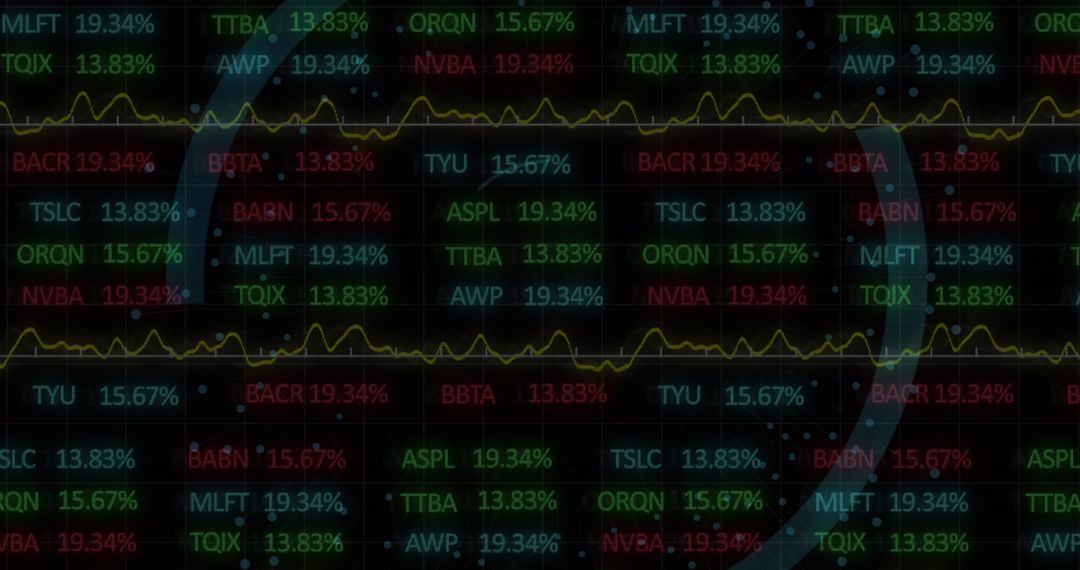
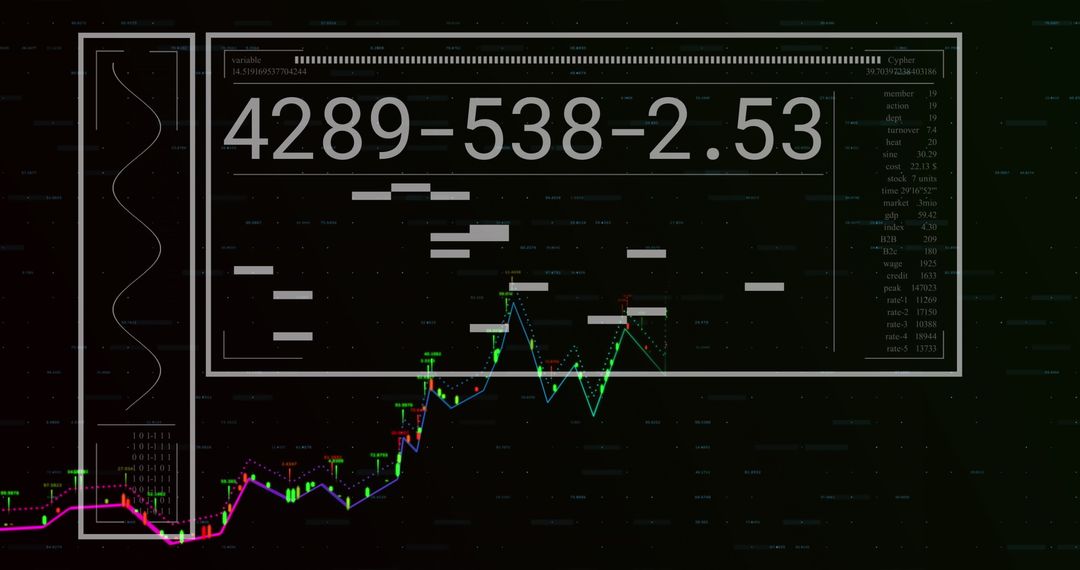
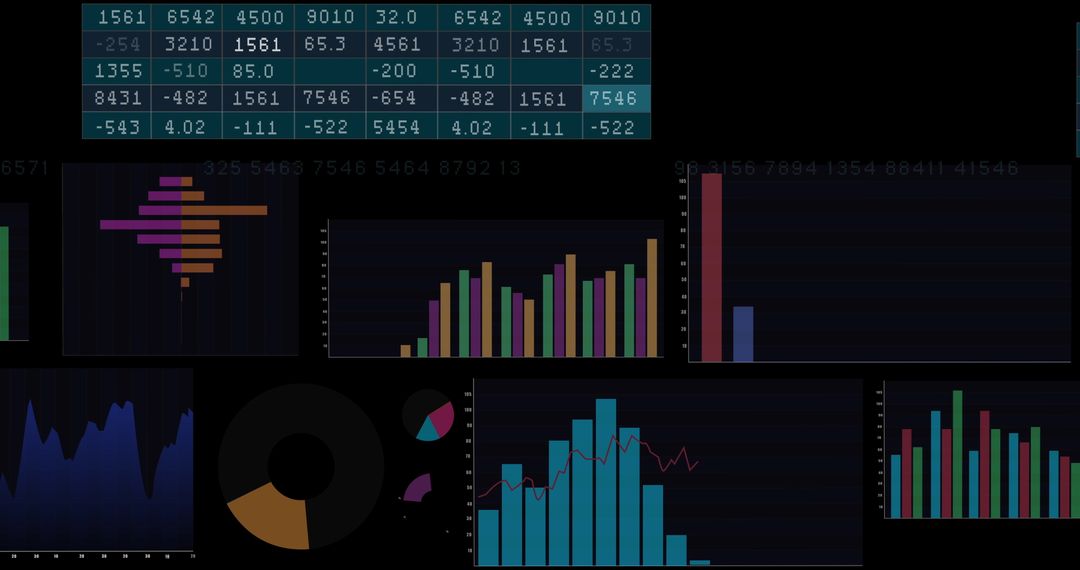
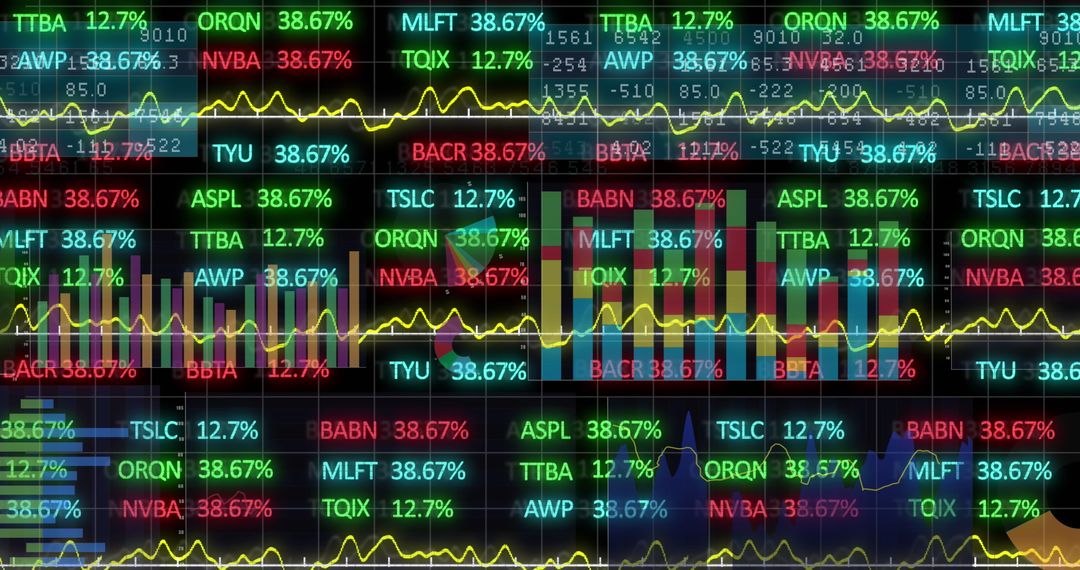
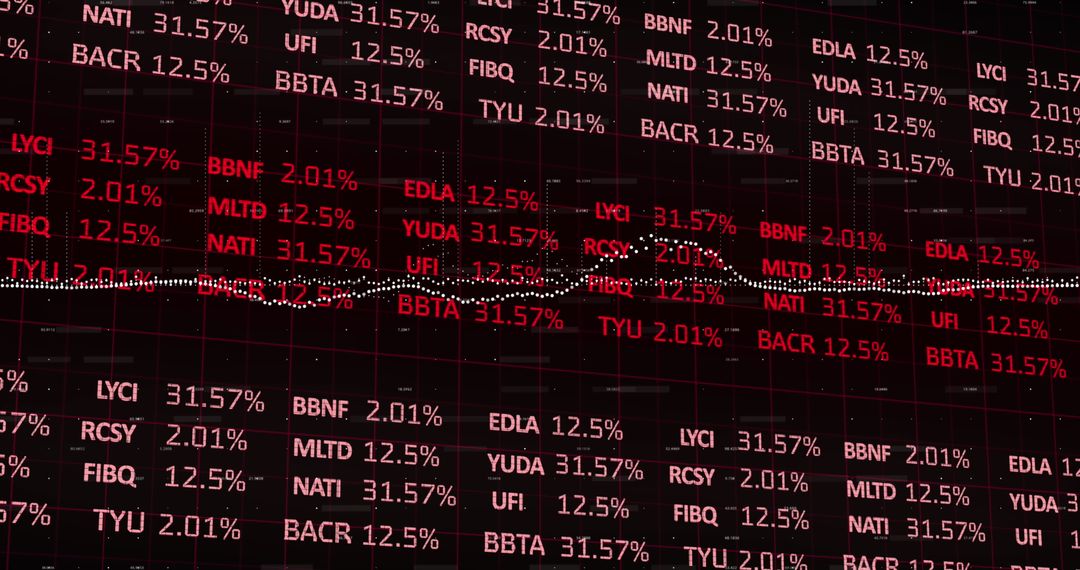
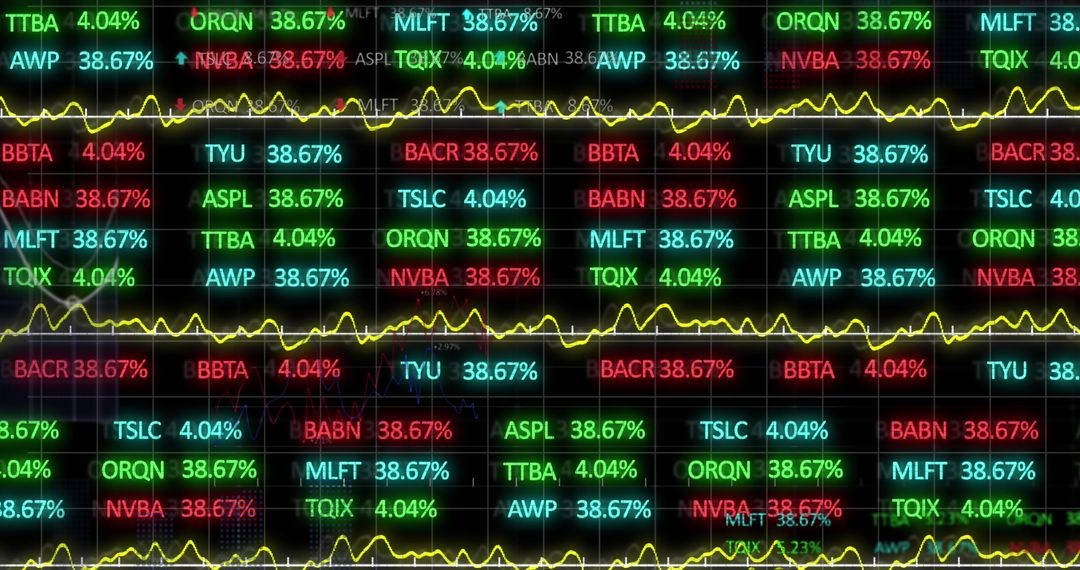
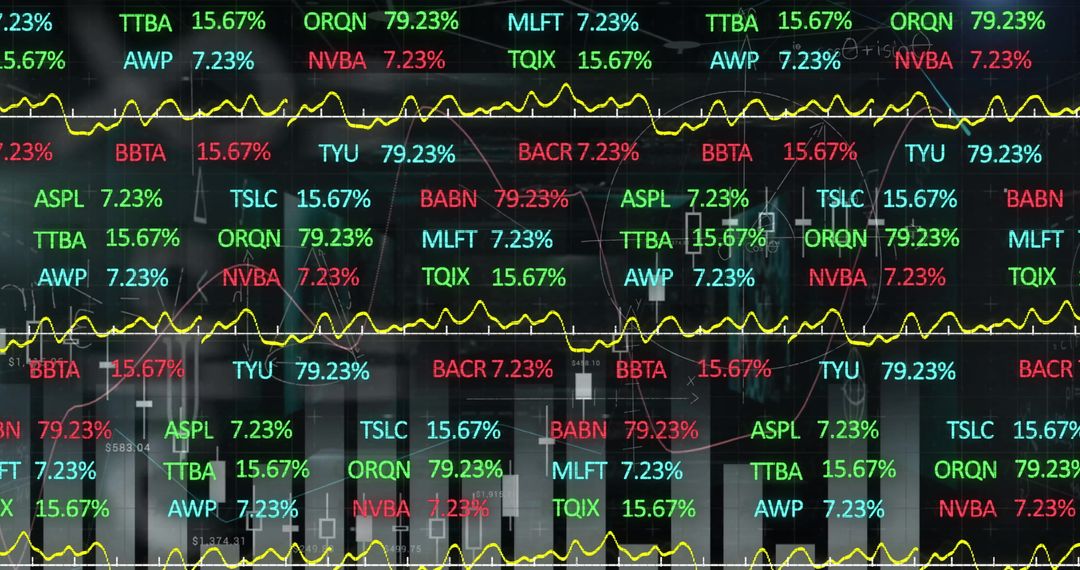
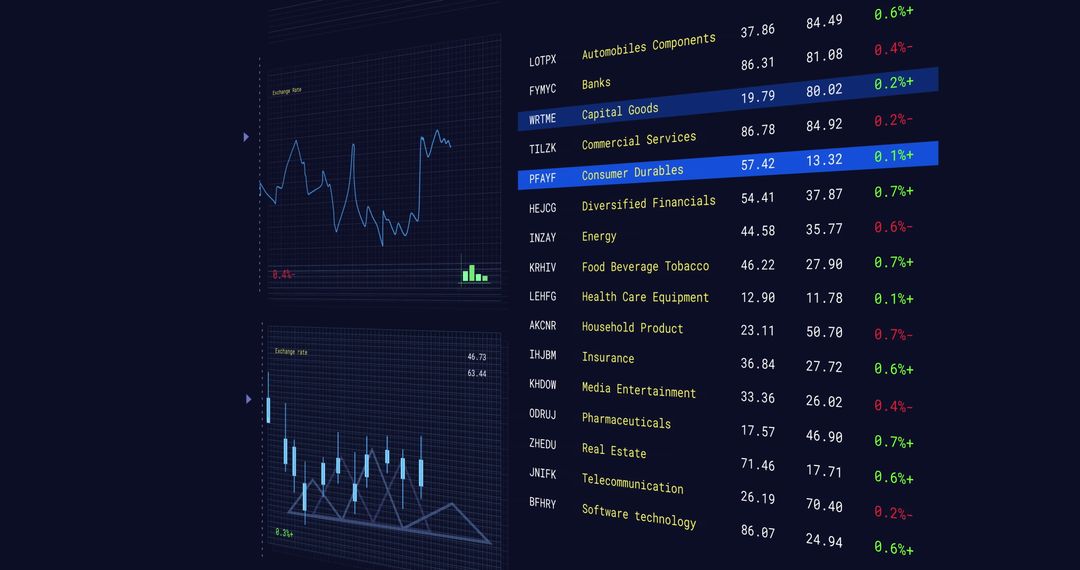
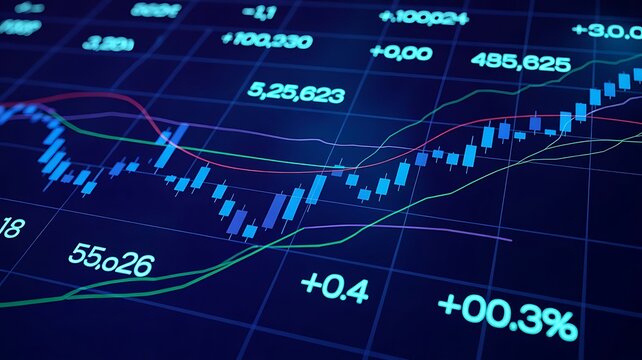
- Financial Data on Digital Screen with Stock Market Analysis
Financial Data on Digital Screen with Stock Market Analysis Image
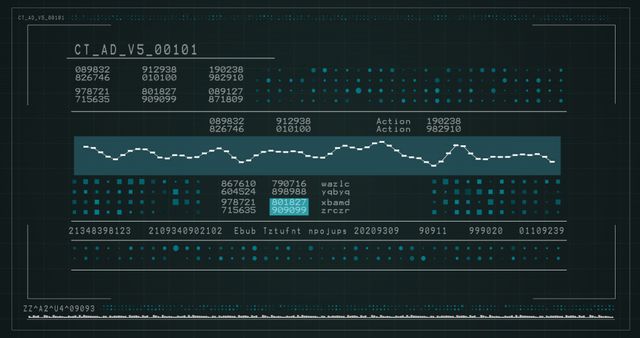
Depicts financial data and stock market values displayed on a digital screen, highlighting trends and analyses. Ideal for illustrating topics related to finance and investment strategies, digital analytics in business, and the intersection of technology and economics.
Powered by 


3
downloads
downloads
Tags:
More
Credit Photo
If you would like to credit the Photo, here are some ways you can do so
Text Link
photo Link
<span class="text-link">
<span>
<a target="_blank" href=https://pikwizard.com/photo/financial-data-on-digital-screen-with-stock-market-analysis/a917b266559103b47b1a41e38ba2842a/>PikWizard</a>
</span>
</span>
<span class="image-link">
<span
style="margin: 0 0 20px 0; display: inline-block; vertical-align: middle; width: 100%;"
>
<a
target="_blank"
href="https://pikwizard.com/photo/financial-data-on-digital-screen-with-stock-market-analysis/a917b266559103b47b1a41e38ba2842a/"
style="text-decoration: none; font-size: 10px; margin: 0;"
>
<img src="https://pikwizard.com/pw/medium/a917b266559103b47b1a41e38ba2842a.jpg" style="margin: 0; width: 100%;" alt="" />
<p style="font-size: 12px; margin: 0;">PikWizard</p>
</a>
</span>
</span>
Free (free of charge)
Free for personal and commercial use.
Author: People Creations
Similar Free Stock Images
Premium


Premium


Premium


Premium


Premium


Premium


Premium


Premium


Premium


Premium


Premium


Premium


Premium


Premium


Premium


Premium


Premium


Premium


Premium


Premium


Premium


Premium


Premium


Premium

