
- Home >
- Stock Photos >
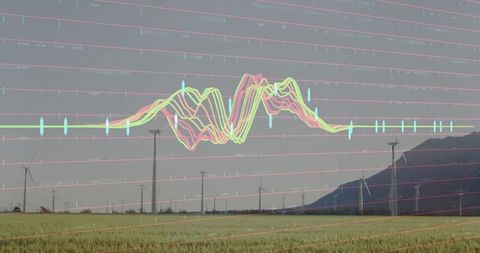
- Financial Data Overlaid on City Skyline
Financial Data Overlaid on City Skyline Image

Illustrating the intersection of data analytics and urban business environments, this visualization shows stock market or financial data over a city’s office buildings. Vivid morphing neon lines represent fluctuating financial metrics. Ideal for use in presentations or articles focused on finance, global economics, urban commercial areas, or technological advances in data processing and investment strategies.
Powered by 


downloads
Tags:
More
Credit Photo
If you would like to credit the Photo, here are some ways you can do so
Text Link
photo Link
<span class="text-link">
<span>
<a target="_blank" href=https://pikwizard.com/photo/financial-data-overlaid-on-city-skyline/afa22b44e1f4d122b753359b4e577e1b/>PikWizard</a>
</span>
</span>
<span class="image-link">
<span
style="margin: 0 0 20px 0; display: inline-block; vertical-align: middle; width: 100%;"
>
<a
target="_blank"
href="https://pikwizard.com/photo/financial-data-overlaid-on-city-skyline/afa22b44e1f4d122b753359b4e577e1b/"
style="text-decoration: none; font-size: 10px; margin: 0;"
>
<img src="https://pikwizard.com/pw/medium/afa22b44e1f4d122b753359b4e577e1b.jpg" style="margin: 0; width: 100%;" alt="" />
<p style="font-size: 12px; margin: 0;">PikWizard</p>
</a>
</span>
</span>
Free (free of charge)
Free for personal and commercial use.
Author: Creative Art
Similar Free Stock Images
Loading...

Premium


Premium

Premium


Premium


Premium


Premium


Premium


Premium


Premium

Premium

Premium


Premium


Premium


Premium


Premium


Premium


Premium


Premium


Premium


Premium


Premium


Premium


Premium


Premium


Premium

Explore More Free Stock Images