
- Home >
- Stock Photos >
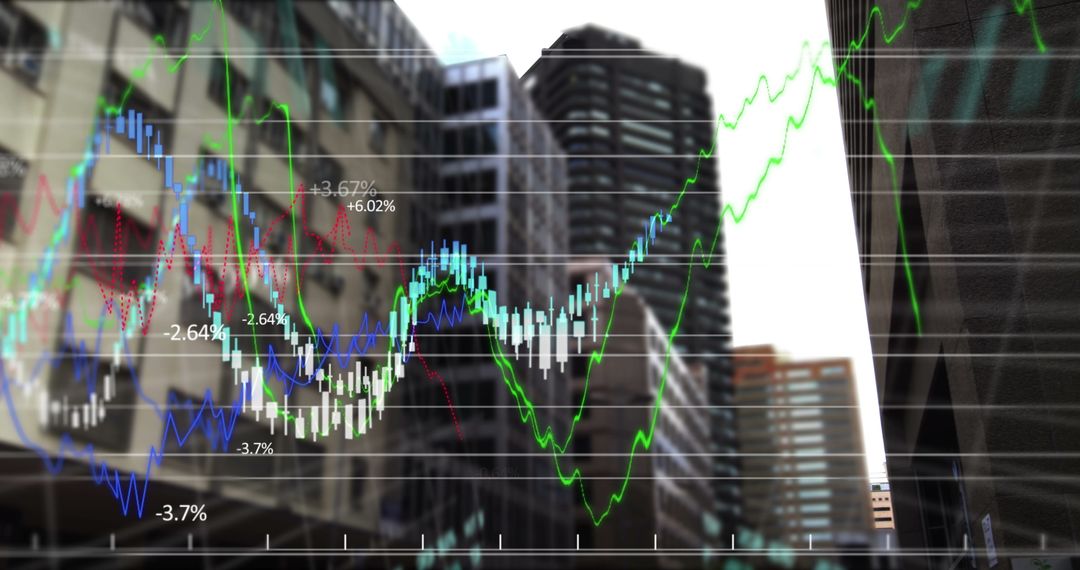
- Financial Data Overlaid on Warehouse Representing Trade and Logistics
Financial Data Overlaid on Warehouse Representing Trade and Logistics Image

This visually engaging composition shows financial data metrics overlaid on an image of a warehouse. The blend represents the interconnectedness of the stock market with the logistics and trade industries. Ideal for use in business presentations or marketing materials for financial services, logistics, and technology solutions, it conveys themes of economic growth, technology, and global trade.
Powered by  - Get 15% off with code: PIKWIZARD15


2
downloads
downloads
Tags:
More
Credit Photo
If you would like to credit the Photo, here are some ways you can do so
Text Link
photo Link
<span class="text-link">
<span>
<a target="_blank" href=https://pikwizard.com/photo/financial-data-overlaid-on-warehouse-representing-trade-and-logistics/57cdeb2e02cb2596871a99bcc7da313e/>PikWizard</a>
</span>
</span>
<span class="image-link">
<span
style="margin: 0 0 20px 0; display: inline-block; vertical-align: middle; width: 100%;"
>
<a
target="_blank"
href="https://pikwizard.com/photo/financial-data-overlaid-on-warehouse-representing-trade-and-logistics/57cdeb2e02cb2596871a99bcc7da313e/"
style="text-decoration: none; font-size: 10px; margin: 0;"
>
<img src="https://pikwizard.com/pw/medium/57cdeb2e02cb2596871a99bcc7da313e.jpg" style="margin: 0; width: 100%;" alt="" />
<p style="font-size: 12px; margin: 0;">PikWizard</p>
</a>
</span>
</span>
Free (free of charge)
Free for personal and commercial use.
Author: Awesome Content
Similar Free Stock Images

Premium


Premium


Premium


Premium


Premium


Premium


Premium


Premium


Premium


Premium


Premium


Premium


Premium


Premium


Premium


Premium


Premium


Premium


Premium


Premium


Premium


Premium


Premium


Premium

