- Home >
- Stock Photos >
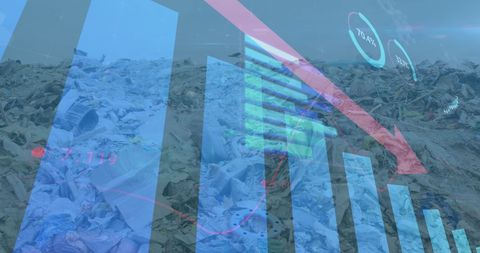
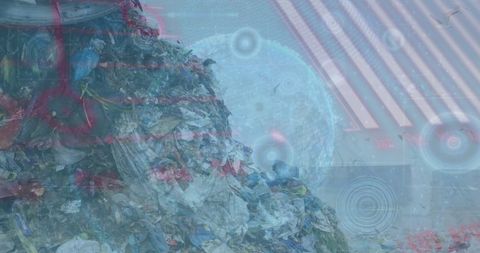
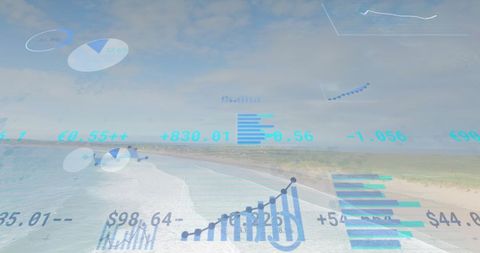
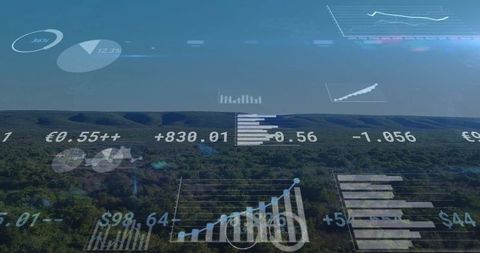
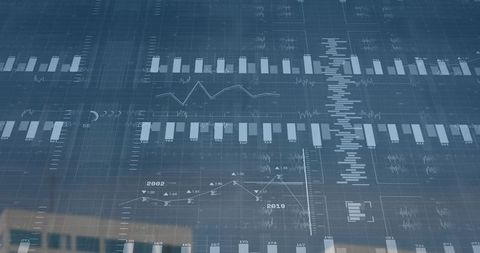
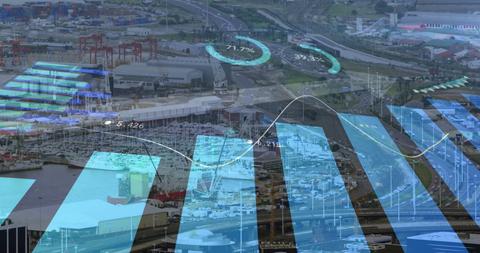
- Financial Data Overlay on Landfill Waste Environment
Financial Data Overlay on Landfill Waste Environment Image

Displays an integration of economic data with environmental impact; suitable for use in discussions on sustainable economies, pollution, economic sustainability, and the intersect of finance with environmental issues.
Powered by 


2
downloads
downloads
Tags:
More
Credit Photo
If you would like to credit the Photo, here are some ways you can do so
Text Link
photo Link
<span class="text-link">
<span>
<a target="_blank" href=https://pikwizard.com/photo/financial-data-overlay-on-landfill-waste-environment/42f39af4e59547284b00eb73ffee47ac/>PikWizard</a>
</span>
</span>
<span class="image-link">
<span
style="margin: 0 0 20px 0; display: inline-block; vertical-align: middle; width: 100%;"
>
<a
target="_blank"
href="https://pikwizard.com/photo/financial-data-overlay-on-landfill-waste-environment/42f39af4e59547284b00eb73ffee47ac/"
style="text-decoration: none; font-size: 10px; margin: 0;"
>
<img src="https://pikwizard.com/pw/medium/42f39af4e59547284b00eb73ffee47ac.jpg" style="margin: 0; width: 100%;" alt="" />
<p style="font-size: 12px; margin: 0;">PikWizard</p>
</a>
</span>
</span>
Free (free of charge)
Free for personal and commercial use.
Author: Creative Art
Similar Free Stock Images
Loading...

Premium


Premium


Premium


Premium


Premium


Premium


Premium


Premium

Premium


Premium


Premium


Premium


Premium


Premium

Premium


Premium


Premium


Premium


Premium


Premium


Premium


Premium


Premium


Premium


Premium