
- Home >
- Stock Photos >
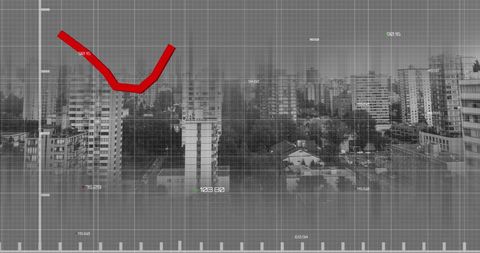
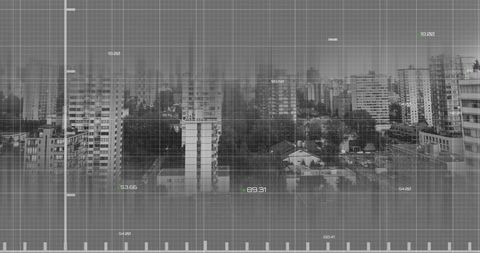
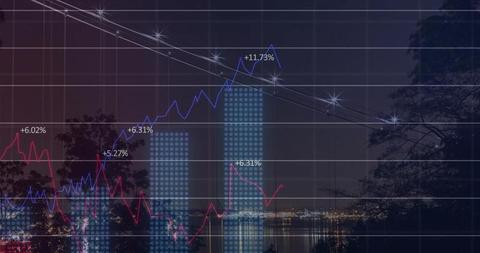
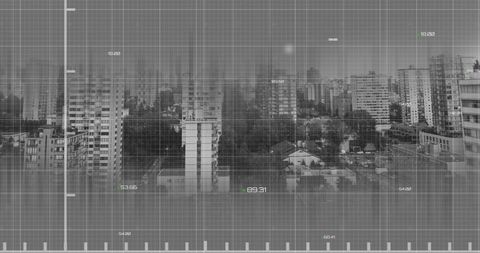
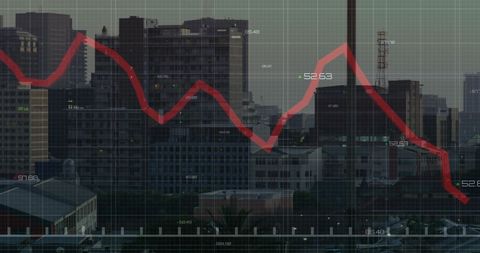
- Financial Data Overlay on Modern Office Buildings
Financial Data Overlay on Modern Office Buildings Image
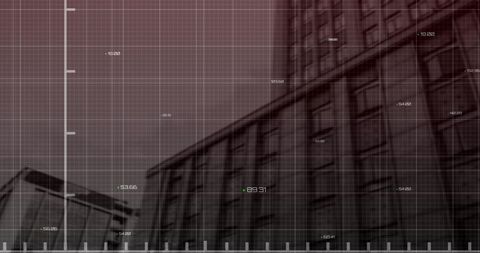
Visual combines financial data with modern office blocks, symbolizing global business and finance interaction. Suitable for illustrating economic forecasts, financial analysis, or business growth trends in presentations and websites.
Powered by  - Get 15% off with code: PIKWIZARD15


downloads
Tags:
More
Credit Photo
If you would like to credit the Photo, here are some ways you can do so
Text Link
photo Link
<span class="text-link">
<span>
<a target="_blank" href=https://pikwizard.com/photo/financial-data-overlay-on-modern-office-buildings/7881a6e5a51199abb7300ba76796e11a/>PikWizard</a>
</span>
</span>
<span class="image-link">
<span
style="margin: 0 0 20px 0; display: inline-block; vertical-align: middle; width: 100%;"
>
<a
target="_blank"
href="https://pikwizard.com/photo/financial-data-overlay-on-modern-office-buildings/7881a6e5a51199abb7300ba76796e11a/"
style="text-decoration: none; font-size: 10px; margin: 0;"
>
<img src="https://pikwizard.com/pw/medium/7881a6e5a51199abb7300ba76796e11a.jpg" style="margin: 0; width: 100%;" alt="" />
<p style="font-size: 12px; margin: 0;">PikWizard</p>
</a>
</span>
</span>
Free (free of charge)
Free for personal and commercial use.
Author: Authentic Images
Similar Free Stock Images

Premium


Premium

Premium


Premium

Premium

Premium


Premium


Premium


Premium

Premium

Premium


Premium

Premium

Premium


Premium

Premium

Premium


Premium


Premium

Premium

Premium

Premium


Premium

Premium

Premium


Explore More Free Stock Images