- Home >
- Stock Photos >
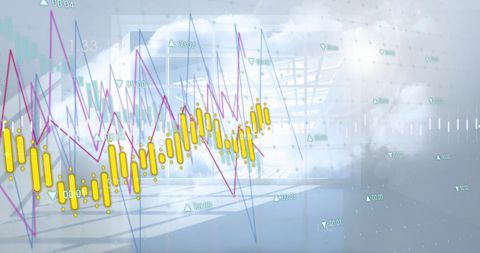
- Financial Data Overlay on Office Desk with Visible Growth Chart
Financial Data Overlay on Office Desk with Visible Growth Chart Image

Visual representation of stock market data on an office desk, integrating laptop use verses digital growth chart, effective for illustrating financial analysis, trading trends, investment opportunities, or technology in finance. Useful for articles, presentations, educating clients, or blogs on investment strategy, market updates and fintech advancements.
Powered by 


0
downloads
downloads
Tags:
More
Credit Photo
If you would like to credit the Photo, here are some ways you can do so
Text Link
photo Link
<span class="text-link">
<span>
<a target="_blank" href=https://pikwizard.com/photo/financial-data-overlay-on-office-desk-with-visible-growth-chart/a74c8f3eec58e1265169752ab8c3ecaa/>PikWizard</a>
</span>
</span>
<span class="image-link">
<span
style="margin: 0 0 20px 0; display: inline-block; vertical-align: middle; width: 100%;"
>
<a
target="_blank"
href="https://pikwizard.com/photo/financial-data-overlay-on-office-desk-with-visible-growth-chart/a74c8f3eec58e1265169752ab8c3ecaa/"
style="text-decoration: none; font-size: 10px; margin: 0;"
>
<img src="https://pikwizard.com/pw/medium/a74c8f3eec58e1265169752ab8c3ecaa.jpg" style="margin: 0; width: 100%;" alt="" />
<p style="font-size: 12px; margin: 0;">PikWizard</p>
</a>
</span>
</span>
Free (free of charge)
Free for personal and commercial use.
Author: Authentic Images
Similar Free Stock Images

Premium


Premium


Premium


Premium


Premium


Premium


Premium


Premium


Premium


Premium


Premium


Premium


Premium


Premium


Premium


Premium


Premium


Premium


Premium


Premium


Premium


Premium


Premium


Premium


Premium