
- Home >
- Stock Photos >
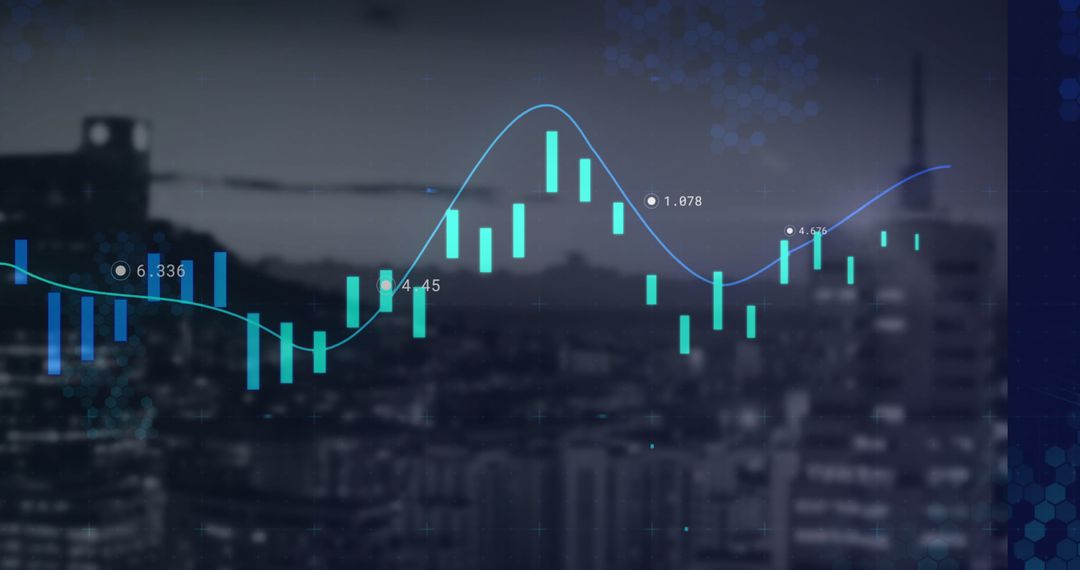
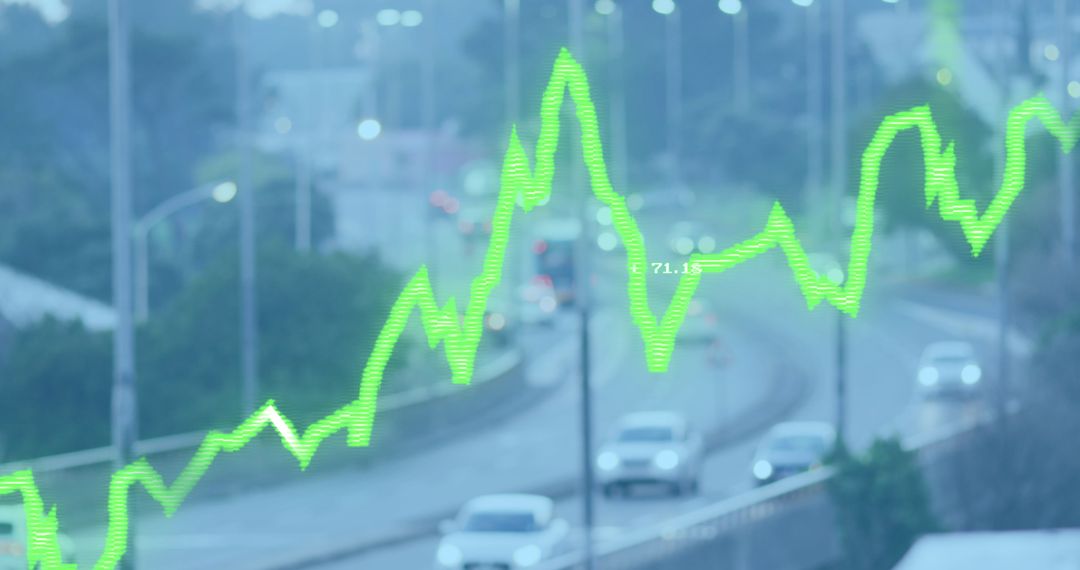
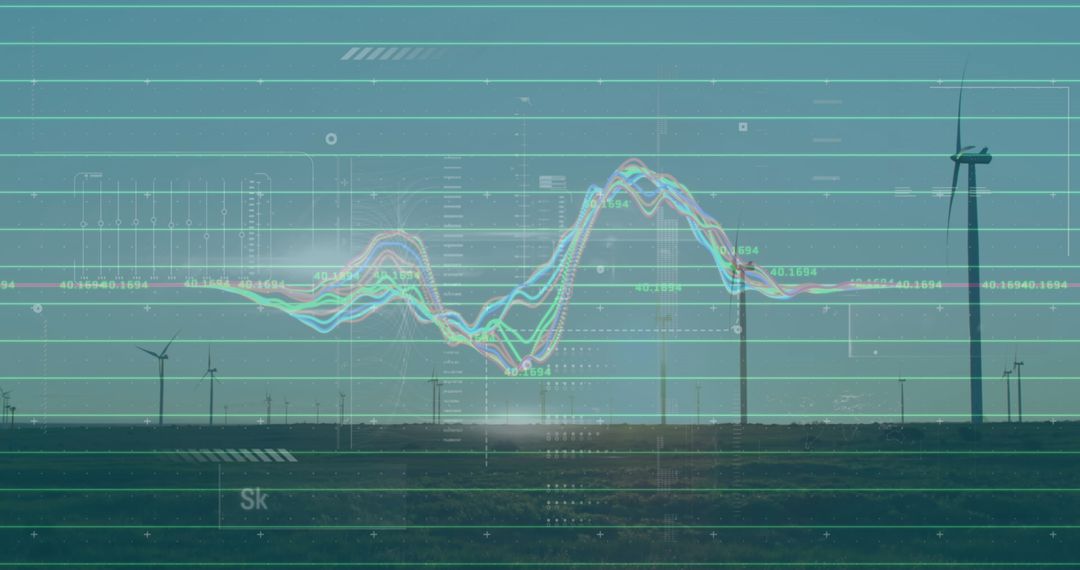
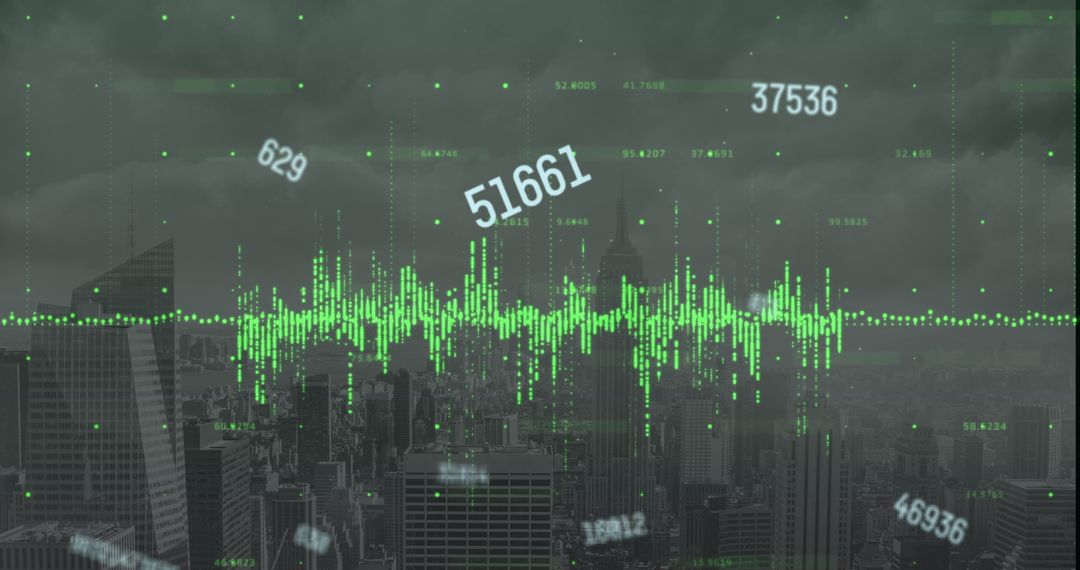
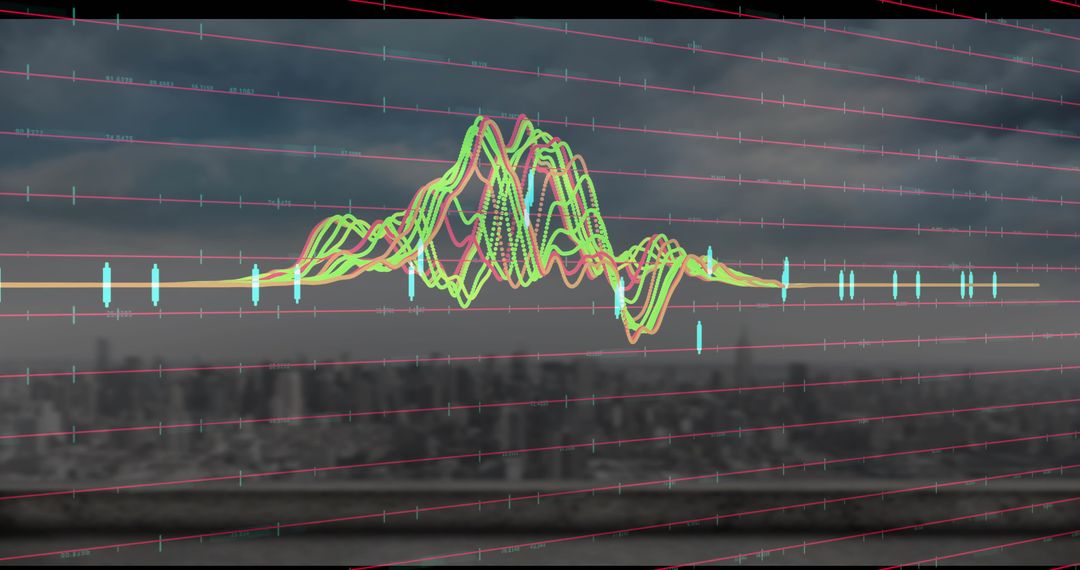
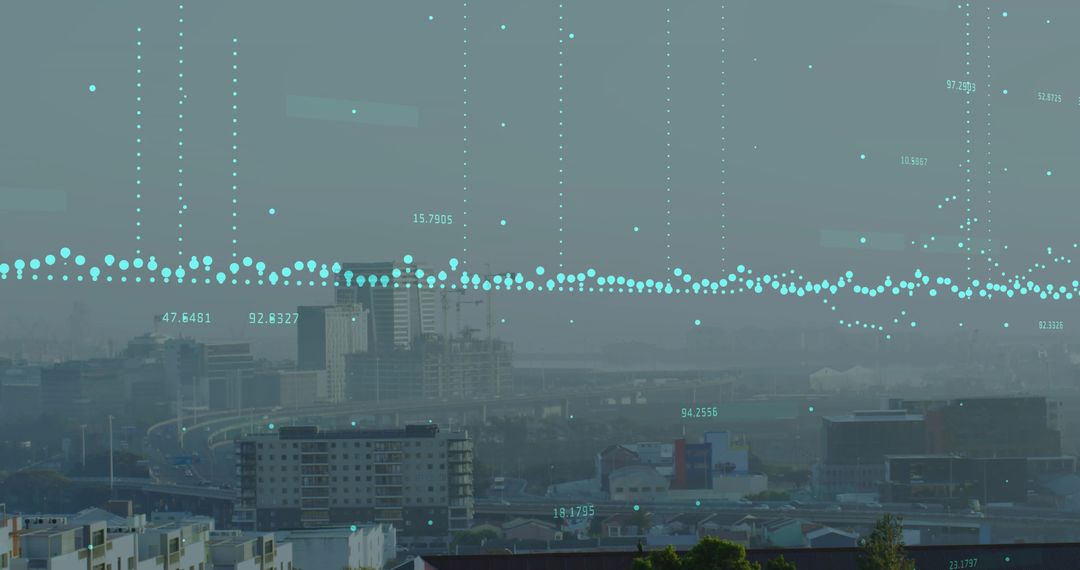
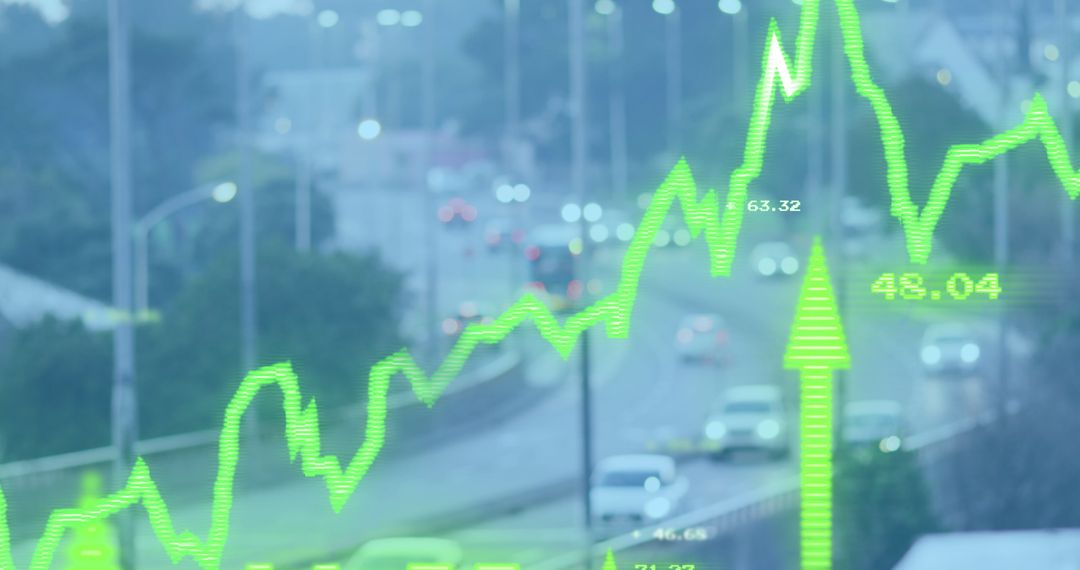
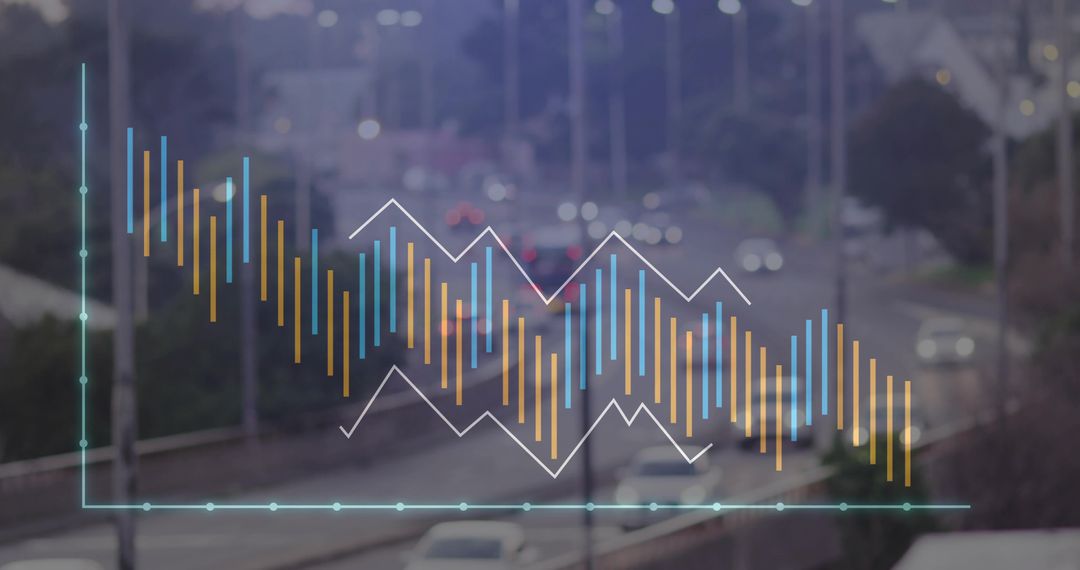
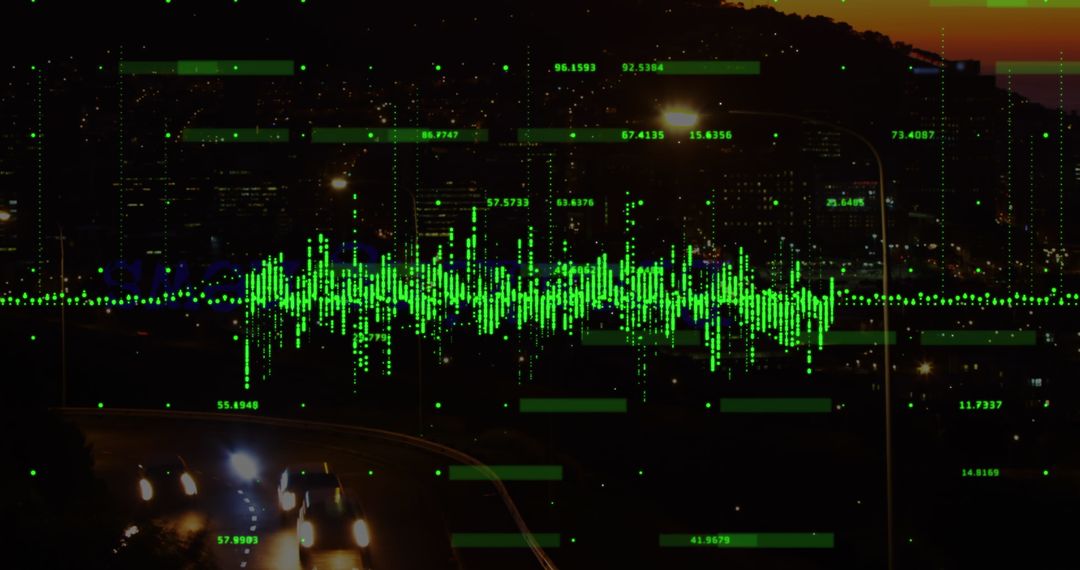
- Financial Data Overlay Streaming over Urban Highway with Candlestick Charts and Traffic
Financial Data Overlay Streaming over Urban Highway with Candlestick Charts and Traffic Image
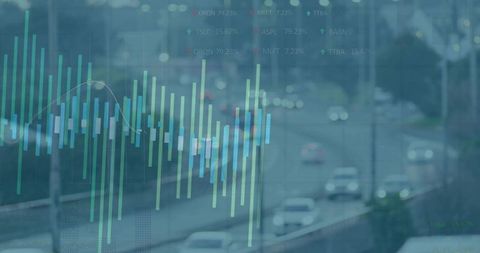
Financial candlestick charts overlaying blurred urban highway traffic, creating futuristic data-driven city vibe. Cool blue-green tones conveying tech-focused atmosphere and subtle glow highlighting market movement. Transparent grid and rising/falling bars suggesting real-time analytics and algorithmic trading activity. Horizontal composition offering ample negative space for headline text and branding. Ideal for fintech websites, trading platform dashboards, financial reports, smart city presentations, traffic analytics articles, and marketing campaigns. Useful as landing page hero, blog header, slide background, social media post, brochure artwork, and editorial illustration. Color palette working well with white or dark text overlays. High visual contrast supporting legibility for typography and icons.
Powered by  - Get 15% off with code: PIKWIZARD15


0
downloads
downloads
Tags:
More
Credit Photo
If you would like to credit the Photo, here are some ways you can do so
Text Link
photo Link
<span class="text-link">
<span>
<a target="_blank" href=https://pikwizard.com/photo/financial-data-overlay-streaming-over-urban-highway-with-candlestick-charts-and-traffic/fb06be4790b8155cd0ee7035efb64bbe/>PikWizard</a>
</span>
</span>
<span class="image-link">
<span
style="margin: 0 0 20px 0; display: inline-block; vertical-align: middle; width: 100%;"
>
<a
target="_blank"
href="https://pikwizard.com/photo/financial-data-overlay-streaming-over-urban-highway-with-candlestick-charts-and-traffic/fb06be4790b8155cd0ee7035efb64bbe/"
style="text-decoration: none; font-size: 10px; margin: 0;"
>
<img src="https://pikwizard.com/pw/medium/fb06be4790b8155cd0ee7035efb64bbe.jpg" style="margin: 0; width: 100%;" alt="" />
<p style="font-size: 12px; margin: 0;">PikWizard</p>
</a>
</span>
</span>
Free (free of charge)
Free for personal and commercial use.
Author: Creative Art
Similar Free Stock Images

Premium


Premium


Premium


Premium


Premium


Premium


Premium


Premium


Premium


Premium


Premium


Premium


Premium


Premium


Premium


Premium


Premium


Premium


Premium


Premium


Premium


Premium


Premium


Premium

