
- Home >
- Stock Photos >
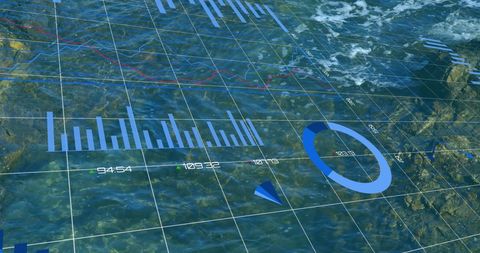
- Financial Data Overlaying Mathematical Equations Concept
Financial Data Overlaying Mathematical Equations Concept Image

Illustrates the intersection of finance and mathematics, showcasing bar charts and complex equations. Useful for businesses, educational content about finance, math or analytics technology designs.
Powered by 


downloads
Tags:
More
Credit Photo
If you would like to credit the Photo, here are some ways you can do so
Text Link
photo Link
<span class="text-link">
<span>
<a target="_blank" href=https://pikwizard.com/photo/financial-data-overlaying-mathematical-equations-concept/e34acac3e240ea62301548cb16a16367/>PikWizard</a>
</span>
</span>
<span class="image-link">
<span
style="margin: 0 0 20px 0; display: inline-block; vertical-align: middle; width: 100%;"
>
<a
target="_blank"
href="https://pikwizard.com/photo/financial-data-overlaying-mathematical-equations-concept/e34acac3e240ea62301548cb16a16367/"
style="text-decoration: none; font-size: 10px; margin: 0;"
>
<img src="https://pikwizard.com/pw/medium/e34acac3e240ea62301548cb16a16367.jpg" style="margin: 0; width: 100%;" alt="" />
<p style="font-size: 12px; margin: 0;">PikWizard</p>
</a>
</span>
</span>
Free (free of charge)
Free for personal and commercial use.
Author: Authentic Images
Similar Free Stock Images

Premium


Premium


Premium


Premium

Premium


Premium


Premium
Premium

Premium


Premium


Premium


Premium


Premium

Premium

Premium


Premium


Premium

Premium


Premium


Premium


Premium


Premium


Premium


Premium


Premium


Explore More Free Stock Images