
- Home >
- Stock Photos >
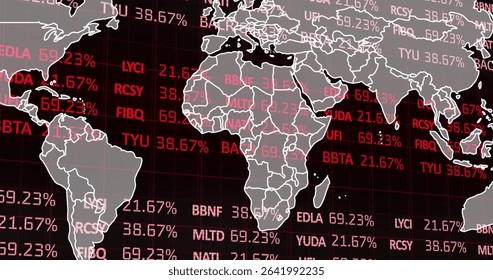
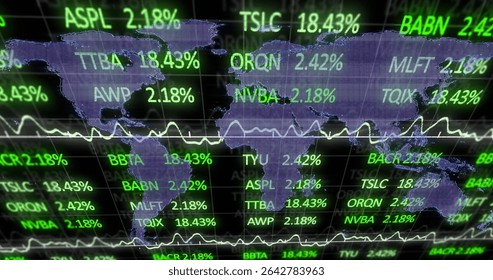
- Financial Data Overlaying World Map in Digital Interface
Financial Data Overlaying World Map in Digital Interface Image

Illustrates the concept of global finance markets with digital figures blended over a world map, reflecting modern technology and international economy insights. Ideal for financial materials, educational guides on market analysis, and technology content related to economic systems.
Powered by  - Get 15% off with code: PIKWIZARD15


downloads
Tags:
More
Credit Photo
If you would like to credit the Photo, here are some ways you can do so
Text Link
photo Link
<span class="text-link">
<span>
<a target="_blank" href=https://pikwizard.com/photo/financial-data-overlaying-world-map-in-digital-interface/103b8adfaae2c6580f1a5fbdc36e9d85/>PikWizard</a>
</span>
</span>
<span class="image-link">
<span
style="margin: 0 0 20px 0; display: inline-block; vertical-align: middle; width: 100%;"
>
<a
target="_blank"
href="https://pikwizard.com/photo/financial-data-overlaying-world-map-in-digital-interface/103b8adfaae2c6580f1a5fbdc36e9d85/"
style="text-decoration: none; font-size: 10px; margin: 0;"
>
<img src="https://pikwizard.com/pw/medium/103b8adfaae2c6580f1a5fbdc36e9d85.jpg" style="margin: 0; width: 100%;" alt="" />
<p style="font-size: 12px; margin: 0;">PikWizard</p>
</a>
</span>
</span>
Free (free of charge)
Free for personal and commercial use.
Author: Authentic Images
Similar Free Stock Images

Premium


Premium

Premium


Premium


Premium


Premium


Premium


Premium

Premium


Premium


Premium


Premium


Premium


Premium


Premium


Premium


Premium

Premium


Premium


Premium


Premium

Premium

Premium


Premium

Premium


Explore More Free Stock Images