
- Home >
- Stock Photos >
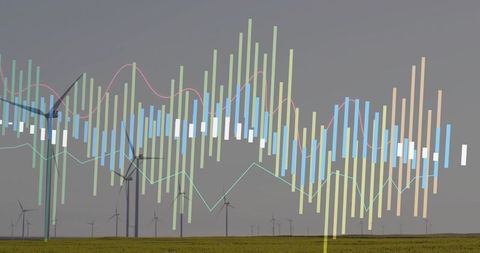
- Financial Data Overlays in Modern Office Workspace
Financial Data Overlays in Modern Office Workspace Image

The image displays colorful financial data graphs and analytics superimposed over an empty office environment. Ideal for use in articles about financial technology, stock market analysis, or business innovation. Can illustrate themes of data-driven decision-making and the impact of technology in modern workplaces.
Powered by 


downloads
Tags:
More
Credit Photo
If you would like to credit the Photo, here are some ways you can do so
Text Link
photo Link
<span class="text-link">
<span>
<a target="_blank" href=https://pikwizard.com/photo/financial-data-overlays-in-modern-office-workspace/c0f467b1cb58b6adc1e9794b8cca5e5a/>PikWizard</a>
</span>
</span>
<span class="image-link">
<span
style="margin: 0 0 20px 0; display: inline-block; vertical-align: middle; width: 100%;"
>
<a
target="_blank"
href="https://pikwizard.com/photo/financial-data-overlays-in-modern-office-workspace/c0f467b1cb58b6adc1e9794b8cca5e5a/"
style="text-decoration: none; font-size: 10px; margin: 0;"
>
<img src="https://pikwizard.com/pw/medium/c0f467b1cb58b6adc1e9794b8cca5e5a.jpg" style="margin: 0; width: 100%;" alt="" />
<p style="font-size: 12px; margin: 0;">PikWizard</p>
</a>
</span>
</span>
Free (free of charge)
Free for personal and commercial use.
Author: Creative Art
Similar Free Stock Images

Premium


Premium

Premium


Premium


Premium


Premium


Premium


Premium

Premium


Premium

Premium


Premium


Premium


Premium


Premium


Premium


Premium


Premium


Premium


Premium


Premium


Premium


Premium


Premium


Premium


Explore More Free Stock Images