- Home >
- Stock Photos >
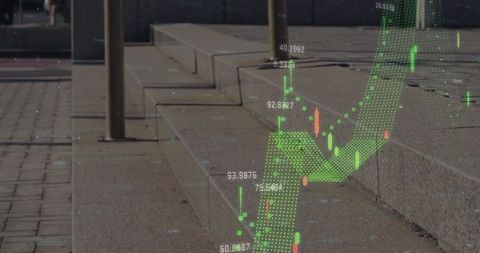
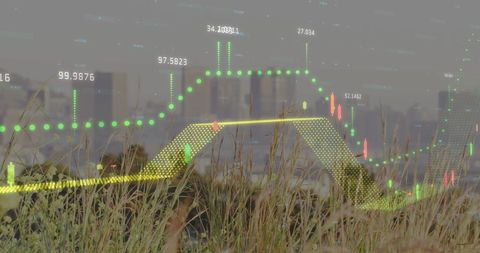
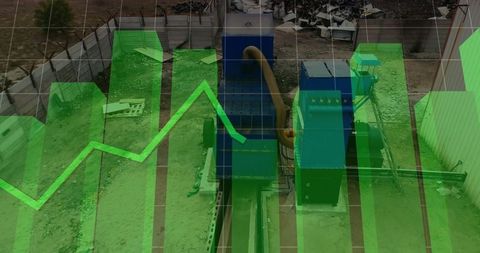
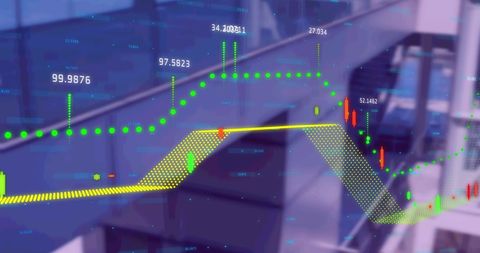
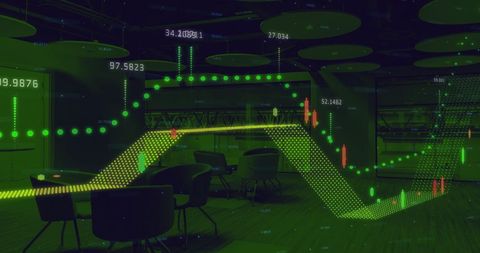
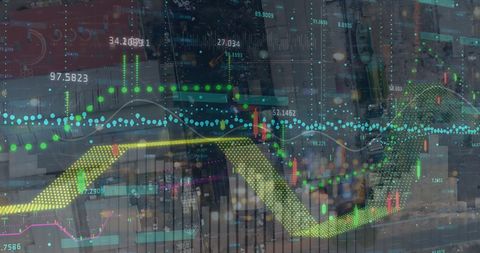
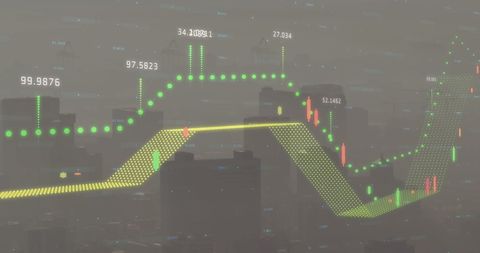
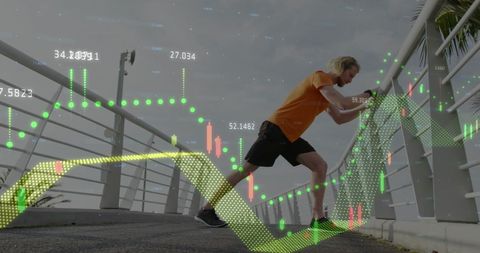
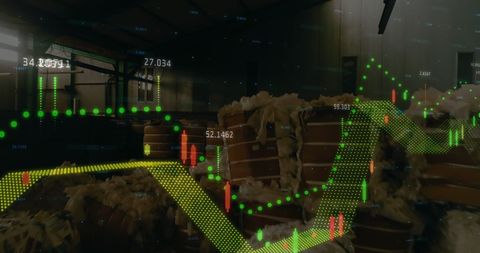
- Financial Data Overlays Industrial Factory Scene
Financial Data Overlays Industrial Factory Scene Image
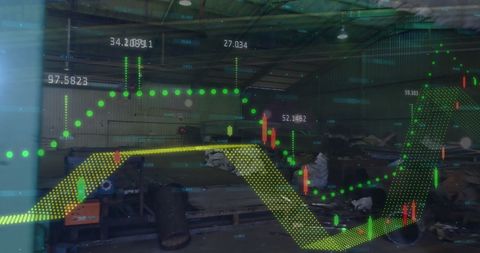
Innovative fusion of financial data displays over busy industrial setting conveys cutting-edge business trends and global economic analytics. Ideal for illustrating themes of modernization in industry, economics, and financial strategies.
Powered by  - Get 15% off with code: PIKWIZARD15


2
downloads
downloads
Tags:
More
Credit Photo
If you would like to credit the Photo, here are some ways you can do so
Text Link
photo Link
<span class="text-link">
<span>
<a target="_blank" href=https://pikwizard.com/photo/financial-data-overlays-industrial-factory-scene/bf538c64f6ac138b4a44fc295e8eebac/>PikWizard</a>
</span>
</span>
<span class="image-link">
<span
style="margin: 0 0 20px 0; display: inline-block; vertical-align: middle; width: 100%;"
>
<a
target="_blank"
href="https://pikwizard.com/photo/financial-data-overlays-industrial-factory-scene/bf538c64f6ac138b4a44fc295e8eebac/"
style="text-decoration: none; font-size: 10px; margin: 0;"
>
<img src="https://pikwizard.com/pw/medium/bf538c64f6ac138b4a44fc295e8eebac.jpg" style="margin: 0; width: 100%;" alt="" />
<p style="font-size: 12px; margin: 0;">PikWizard</p>
</a>
</span>
</span>
Free (free of charge)
Free for personal and commercial use.
Author: People Creations
Similar Free Stock Images
Loading...

Premium


Premium


Premium


Premium


Premium


Premium


Premium


Premium


Premium


Premium


Premium


Premium
Premium


Premium
Premium


Premium


Premium


Premium


Premium


Premium


Premium


Premium


Premium


Premium


Premium