
- Home >
- Stock Photos >
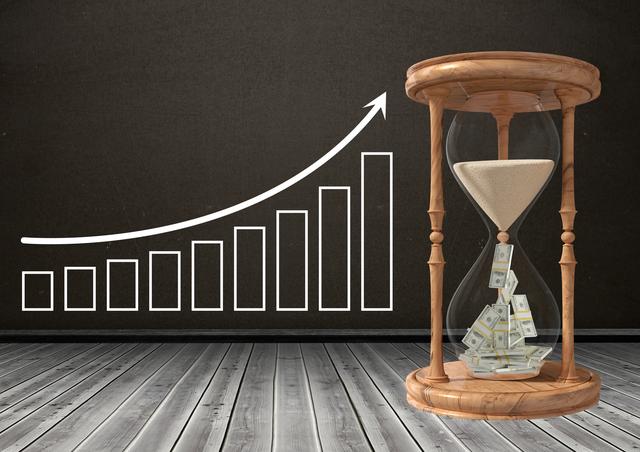
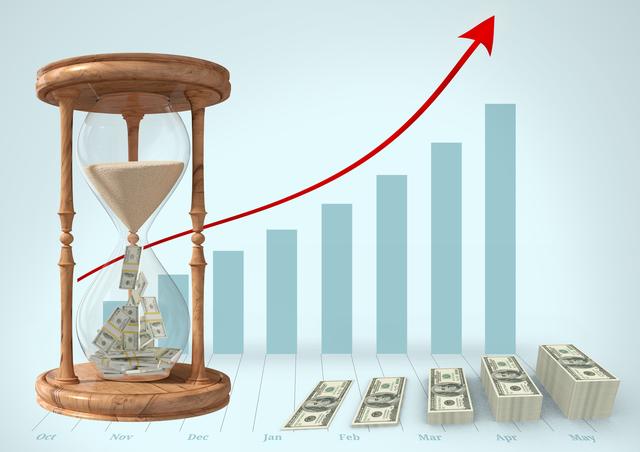
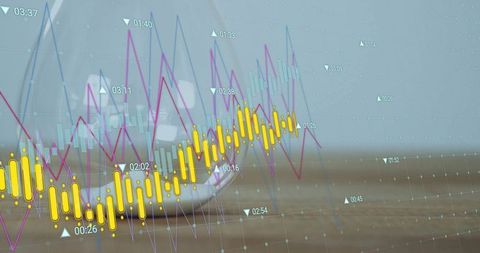
- Financial Data Overlays on Transparent Hourglass Illustration
Financial Data Overlays on Transparent Hourglass Illustration Image
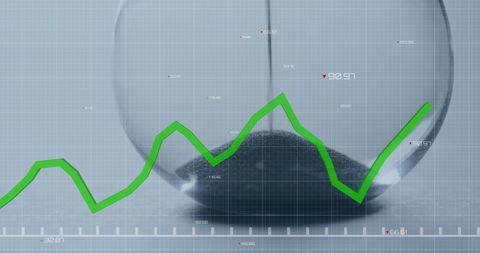
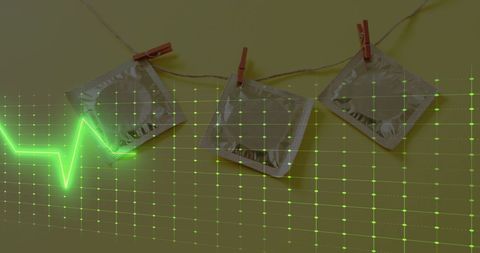
Image presents an intersection of time management and financial analytics via a green line graph superimposed over an hourglass. Useful for illustrating concepts in finance, stock market projections, time value of money, and business efficiency strategies. Creative applications include articles on financial planning, future market forecasting, or investment growth potential.
Powered by  - Get 15% off with code: PIKWIZARD15


3
downloads
downloads
Tags:
More
Credit Photo
If you would like to credit the Photo, here are some ways you can do so
Text Link
photo Link
<span class="text-link">
<span>
<a target="_blank" href=https://pikwizard.com/photo/financial-data-overlays-on-transparent-hourglass-illustration/fdf004c3db15008ca5ff328f05e40be2/>PikWizard</a>
</span>
</span>
<span class="image-link">
<span
style="margin: 0 0 20px 0; display: inline-block; vertical-align: middle; width: 100%;"
>
<a
target="_blank"
href="https://pikwizard.com/photo/financial-data-overlays-on-transparent-hourglass-illustration/fdf004c3db15008ca5ff328f05e40be2/"
style="text-decoration: none; font-size: 10px; margin: 0;"
>
<img src="https://pikwizard.com/pw/medium/fdf004c3db15008ca5ff328f05e40be2.jpg" style="margin: 0; width: 100%;" alt="" />
<p style="font-size: 12px; margin: 0;">PikWizard</p>
</a>
</span>
</span>
Free (free of charge)
Free for personal and commercial use.
Author: People Creations
Similar Free Stock Images
Loading...


Premium


Premium


Premium

Premium

Premium


Premium


Premium


Premium


Premium


Premium


Premium

Premium

Premium

Premium


Premium

Premium


Premium


Premium


Premium


Premium


Premium


Premium


Premium


Premium


Premium
