- Home >
- Stock Photos >
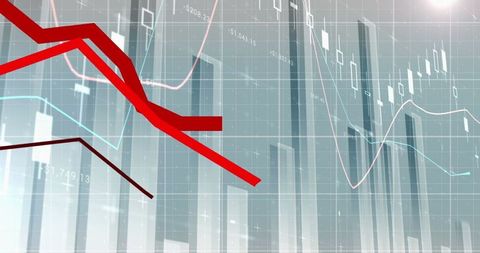
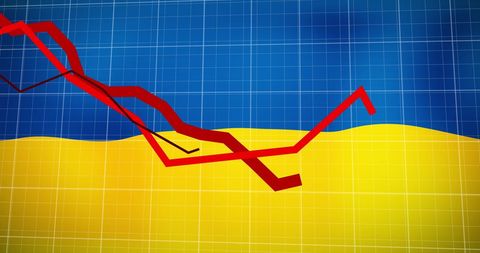
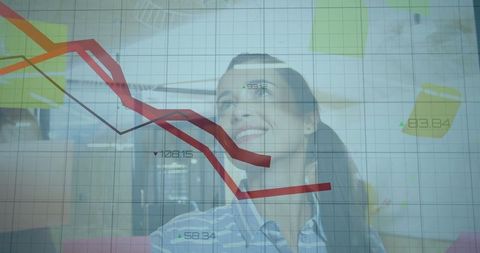
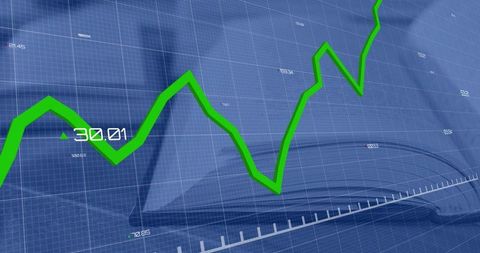
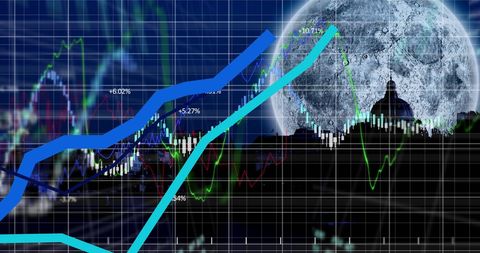
- Financial Data Processing and Analysis with Digital Interface
Financial Data Processing and Analysis with Digital Interface Image

Overlapping digital charts and graphs showcase financial metrics and stock market trends against a high-tech blue grid background. Ideal for use in global business presentations, finance reports, and articles on market analysis or economic trends. Its modern design highlights advanced data processing and analytics capabilities.

downloads
Tags:
More
Credit Photo
If you would like to credit the Photo, here are some ways you can do so
Text Link
photo Link
<span class="text-link">
<span>
<a target="_blank" href=https://pikwizard.com/photo/financial-data-processing-and-analysis-with-digital-interface/49734b0552396b6e59ea47bb0663b4f4/>PikWizard</a>
</span>
</span>
<span class="image-link">
<span
style="margin: 0 0 20px 0; display: inline-block; vertical-align: middle; width: 100%;"
>
<a
target="_blank"
href="https://pikwizard.com/photo/financial-data-processing-and-analysis-with-digital-interface/49734b0552396b6e59ea47bb0663b4f4/"
style="text-decoration: none; font-size: 10px; margin: 0;"
>
<img src="https://pikwizard.com/pw/medium/49734b0552396b6e59ea47bb0663b4f4.jpg" style="margin: 0; width: 100%;" alt="" />
<p style="font-size: 12px; margin: 0;">PikWizard</p>
</a>
</span>
</span>
Free (free of charge)
Free for personal and commercial use.
Author: Creative Art