- Home >
- Stock Photos >
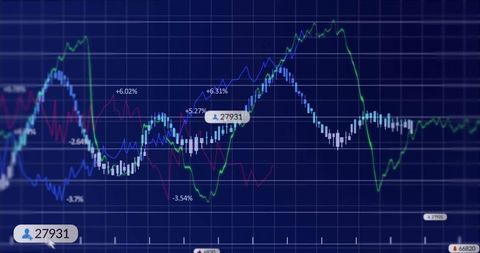
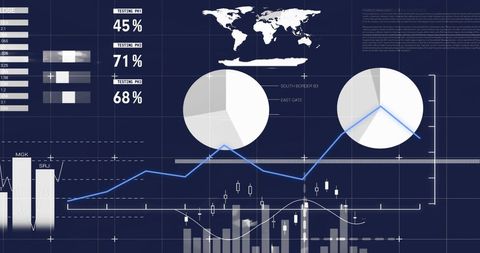
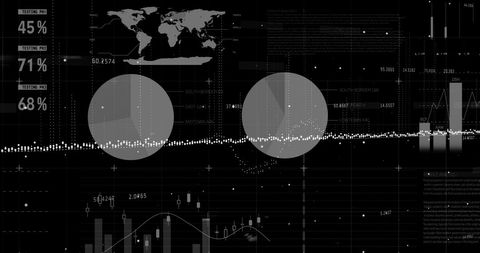
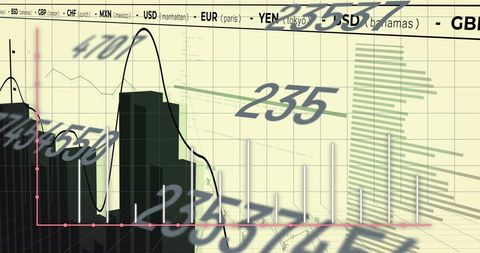
- Financial Data Processing and Analytics on Blue Background
Financial Data Processing and Analytics on Blue Background Image

Abstract visualization of financial data processing symbolsically capturing financial analysis, stock market overviews and economic management. Suitable for illustrating articles about stock markets, economic management, business reports, financial forecasts and big data analytics concepts.

downloads
Tags:
More
Credit Photo
If you would like to credit the Photo, here are some ways you can do so
Text Link
photo Link
<span class="text-link">
<span>
<a target="_blank" href=https://pikwizard.com/photo/financial-data-processing-and-analytics-on-blue-background/c19c61a7732ed8e16e7bad9f3a9b6232/>PikWizard</a>
</span>
</span>
<span class="image-link">
<span
style="margin: 0 0 20px 0; display: inline-block; vertical-align: middle; width: 100%;"
>
<a
target="_blank"
href="https://pikwizard.com/photo/financial-data-processing-and-analytics-on-blue-background/c19c61a7732ed8e16e7bad9f3a9b6232/"
style="text-decoration: none; font-size: 10px; margin: 0;"
>
<img src="https://pikwizard.com/pw/medium/c19c61a7732ed8e16e7bad9f3a9b6232.jpg" style="margin: 0; width: 100%;" alt="" />
<p style="font-size: 12px; margin: 0;">PikWizard</p>
</a>
</span>
</span>
Free (free of charge)
Free for personal and commercial use.
Author: Awesome Content