1. Home > 
  2. Stock Photos > 
  3. Financial Data Processing and Global Business Projection

Financial Data Processing and Global Business Projection Image

Financial Data Processing and Global Business Projection

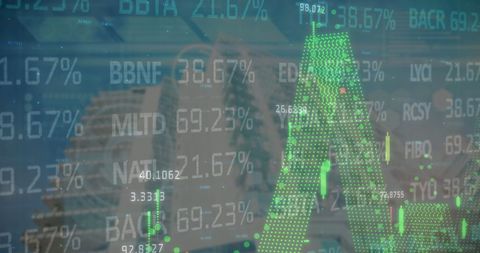
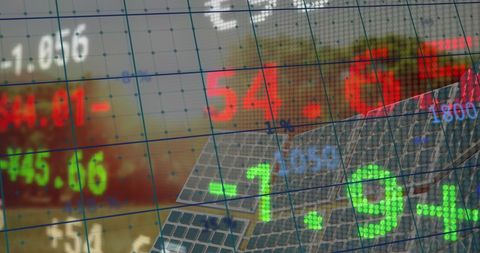
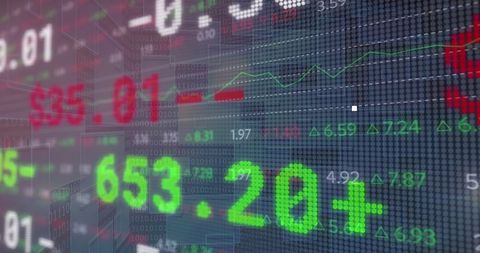
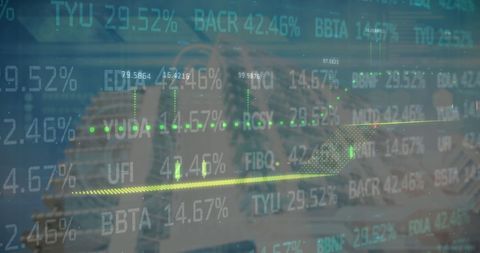
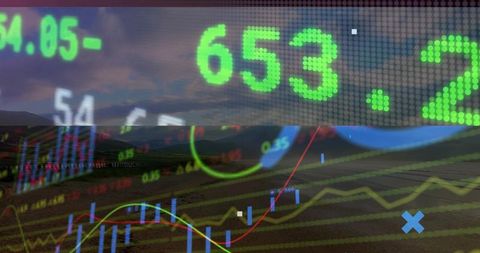
Overlay of growing and declining financial bar graphs on wristwatch face suggests the complexity of global financial markets. Digital visuals emphasize economic trends such as growth and recession.creative depiction ideal for presentations, reports, articles on financial growth evaluation, investment strategies, or economic policies forecasting.

Powered by Shutterstock logo - Get 15% off with code: PIKWIZARD15
Business, finance and investment concept. Businessman using digital tablet analyzing and calculating financial data with economic graph growth chart, Business strategy and planning. market research - Powered by Shutterstock - Get 15% off with code: PIKWIZARD15Businessman using laptop computer analyzing sales data and financial growth graph chart report. Business planning, strategy and development. Financial accounting. market research, data analysis - Powered by Shutterstock - Get 15% off with code: PIKWIZARD15Internet cyberspace data information collection analytical statistics computer storage ai artificial intelligence calculation, blue background banner copyspace. - Powered by Shutterstock - Get 15% off with code: PIKWIZARD15Two diverse crypto traders brokers stock exchange market investors discussing trading charts research reports growth using pc computer looking at screen analyzing invest strategy, financial risks. - Powered by Shutterstock - Get 15% off with code: PIKWIZARD15Abstract glowing big data forex candlestick chart on blurry city backdrop. Trade, technology, investment and analysis concept. Double exposure - Powered by Shutterstock - Get 15% off with code: PIKWIZARD15

Credit Photo

If you would like to credit the Photo, here are some ways you can do so

Free (free of charge)

Free for personal and commercial use.

Author: Creative Art

Similar Free Stock Images

Loading...
Futuristic Digital Neon Light Trails with Glitch Effect
Premium
Analyst working with Financial Data and Business Analytics Dashboard on computer to make Financial Report with KPI and Metrics. Investment, Corporate Finance, Strategy, Operations, Sales.
Data Processing Overlay on Fuel Gauge Concept
Digital Auto Dashboard with Data Analytics Interface
Digital Interface with Stock Market Data Overlay on Cityscape
Digital Display of Stock Market Fluctuations in Coronavirus Context
Premium
Businesswoman analyzing financial data at her desk, she checks charts and graphs showing economic growth, focusing on investment trends and marketing strategies in modern office.
Digital Display of Stock Market Numbers with Globe Interface
Premium
Business strategy development and growing growth plan.	
Financial management strategy for business growth.Graph and chart. Investment of growth on currency rate.
Digital Stock Market Display with Currency Indicators
Digital Data Growth in Advanced Server Room Surrounded by Financial Charts
Stock Market Growth Concept with Green Bar Graphs and Tickers
Digital Data Overlay on Solar Panel for Global Business Concept
Premium
abstract Financial chart with moving up growing stock market graph in blue light color background
Financial Data Analysis with Growing Chart and Time Icons
Digital Financial Data, Stock Market Analysis
Dynamic Financial Data Display with Moving Graph Lines
Dynamic Stock Market Finance Data Exchange Grid Abstract Illustration
Futuristic Digital Data Interface with Circular Scanner
Abstract Financial Forecast with Cityscape Background
Dynamic Digital Financial Indicators on Display
Digital Data Absorbing Modern Skyscrapers Reflecting Global Business
Premium
Stock market analysis, business, finance and investment. Finance analyst analyzing stock market trading graph, economic growth chart, planning and strategy, business investment with financial report
Digital Finance Interface with Glitched Data on Screen
Finance and Time Integration: Digital Data Overlay on Clock
Financial Data and Clock Overlay with Dynamic Graphs
Futuristic Digital Interface with Analytical Data Display
Digital Stock Market Chart with Colorful Finance Data Visuals
Financial Data Chart Overlay on Urban Cityscape
Digital Financial Data Overlaid on Cityscape Symbolizing Global Business
Premium
Business finance and investment, Analyze economic growth charts for informed business finance decisions and financial decision-making. Stock Market report, Strategy, Data Collection, Forecasting
Glowing Cyan-Blue Dot-Matrix Ticker Showing 54.65 with Lens Flare and Futuristic Finance UI
Futuristic Digital Scanner with Neon Lights and Glitch Effects
Dynamic Stock Market Financial Data Display Over Grid
Premium
Businessman using KPI dashboard.Financial business KPI System data analytics graph dashboard.Data System KPI and metrics connected in database for follow earnings,operations and sales data.
Digital Stock Market Screen Over Cityscape Buildings
Dynamic Stock Market Data Overlay with Blue Digital Interface
Digitized Stock Market Display on Financial District Building
Stock Market Data and Finance Technology Background
Premium
Finance, banking and investment, Asset allocation, budget management. Business woman calculating financial report, cost control and budgeting with business data graph growth chart. Tax and budgeting
Stock Market Data Overlay on City Buildings
Dynamic Digital Stock Market Display with Clock Overlay
Digital Code Projection Over Server Room Reflects Global Economy Trends
Digital Bar Graph Display in Financial Data Analysis
Premium
Stock market or forex trading graph on touchscreen,  finance and investment concept. Economy trends for business, financial charts and digits.
Analyzing Global Stock Exchange Data Digital Interface
Rising Stock Market Graph on Digital Interface
Rising Bar Graph and Currency Symbols on Digital Screen
Futuristic Stock Market Interface with Security Shield
Premium
Working young business trader pointing on market stock graph data planning in real time monitor with back side view at neon modern office. Concept of analyzing dynamic financial exchange rate. Gusher.
Premium
Financial advisor explaining invest stock market data consulting investor. Two busy business men analysts doing finance trading analysis pointing at exchange chart on laptop screen working in office.
Premium
Business woman sitting front laptop computer with financial graphs and statistics on monitor. Double exposure. Wide
Digital Blockchain Technology in Server Room with Crypto Overlay
Global Financial Data and Trends on Digital Background
Abstract Digital Mandala with Coding Symbols
Premium
graph stock market economics, chart growth business to success globally. concept of investment, plan strategy, increase profit, financial economy, and grow marketing. digital technology trend
Premium
Charts of financial instruments with various type of indicators including volume analysis for professional technical analysis on the monitor of a computer. Fundamental and technical analysis concept.
Premium
Analysis finance grow graph and market investment. Financial business plan,earnings,sale and strategy. Stock market chart, exchange financial growth diagram.
Financial Data Displayed on Circuit Board Background
Global Financial Data Analytics with Interactive Bar Graphs and World Map
Real-Time Stock Market Data with Red and Green Numerical Values
Digital Stock Market Ticker Display on Urban Skyscraper Backdrop
Premium
Businessman Drawing Upward Arrow on Digital Stock Market Graph with Trading Data, Buy and Sell Indicators, Representing Financial Growth, Investment Success Foreign currency trading and Forex Trading
Digital Stock Market Data Visualization with Financial Graphs
Digital Interface with Deleting Files and Financial Data Overlay
Digital Interface Displaying Data Analytics on Car Dashboard
Digital Stock Market Data Display Over Urban Skyline
Stock Market Data Overlay on Urban Architecture
Digital Data of Cryptocurrency Trends and Financial Analysis
Data Processing and Global Business Digital Visualization
Futuristic Warehouse Logistics with Digital Overlay
Cybersecurity Concept with Digital Lock and Market Data Overlay
Dynamic Stock Market Data Overlayed on Skyscrapers
Global Stock Market Ticker Over Implied Clock
Premium
Trader analyzing data on virtual screen.Price graph and indicator. Stock market invest and crypto currency. Stock market and business investment.
Solar Energy Revolution Driven by Digital Data Demand
Digital Data Processing Overlay in Server Room Visualization
Digital Data Overlapping Clock with Currency Indicators
Digital Data Processing and Stock Market Analysis Concept
Premium
Businesswomen use magnifier glass find stock in stock markets, uptrends, growth economics, business strategy development, and opportunities for investment, take profit from funds, Financial Analyst.
Digital Lines Financial Data Display on Blue Background
Rising Green and Red Bar Charts over Digital Data Display
Dynamic Financial Data Processing Background
Digital Financial Data Abstract Over Dark Background
Premium
Stockmarket online trading chart candlestick on crypto currency platform. Stock exchange financial market price candles graph data pattern analysis concept. Computer screen closeup background
Futuristic 5G Network and Technology Concept
Global Financial Data Analysis with Graphs and Clock Visualization
Dynamic Display of Stock Market Data with Innovation Theme
Digital Graphs Indicating Stock Market Data Trends
Financial Data Processing with Digital Graphs and Numbers
Premium
Conference Business Meeting Presentation: CEO Businessman Shows Data to Group of Investors, Businessspeople. Projector Screen Shows Graphs, Product Sales, Revenue Growth Strategy, e-Commerce Analysis
Dynamic Financial Data Display with Compass Background
Dynamic Stock Ticker Display with Currency Signs and Charts
High-Tech Data Center Corridor with Digital Overlays
Abstract Financial Background with Business Text Overlay
Digital Dashboard: Analyzing Global Business and Financial Data
Digital Business Dashboard with Car Gauge
Premium
Analysis finance grow graph and market  investment. Financial  business plan,earnings,sale and strategy. Stock market chart, exchange financial growth diagram.
Premium
Two businesspeople or an accountant team are analyzing data charts, graphs, and a dashboard on a laptop screen in order to prepare a statistical report and discuss financial data in an office
Digital Data Interface with Stock Market Display
Financial Data Overlay on Solar Panels Symbolizing Green Economy
Digital Lock Overlaying Illuminates Stock Market Data
Global Financial Data Overlaying Metropolitan Skyline
Premium
Businessman analyzing forex trading graph financial data. Stock Market Investments Funds and Digital Assets. Business finance technology and investment concept. Business finance background.
Digital Interface with Stock Market Analytics and Server Room
Financial Growth and Decline with Stock Market Data Visualization
Global Business Interface with Solar Panel Projections
Modern Digital Financial Information Display on Screen
Premium
Stock market or forex trading graph in futuristic concept suitable for financial investment or Economic trends business idea and all art work design. Abstract finance background
Digital Stock Market Analytics with Futuristic Interface
Global Financial Data with Social Media Interface Overlay
Global Financial Trading Data Display on Digital Screen
Abstract Financial Data with Dynamic Digital Visualization
Global Financial Data Overlaid on Modern Cityscape
Digital Interface of Global Business and Finances Concept
Dynamic Financial Data Display over Digital Grid
Global Financial Data Processing with Digital Network Connections
Dynamic Financial Technology with Data and Time Insights
Financial Data Integrated with Global Time Concepts Art
Stock Market Data Displayed Overlying Computer Server Racks
Digital Data Processing with Dynamic Charts and Numbers Animation
Digital Currency Exchange Display on Circuit Board Background
Premium
Businessman analyzes profitability of working companies with digital augmented reality graphics, positive indicators in 2024, businessman calculates financial data for long-term investments.
Blending Stock Market Analytics with Rural Dawn Landscape
LED Ticker Displaying Financial Data and Line Graph