
- Home >
- Stock Photos >
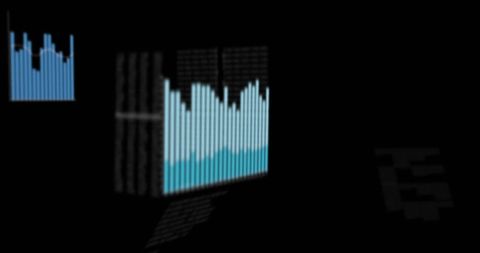
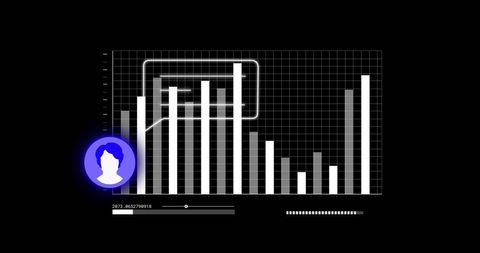
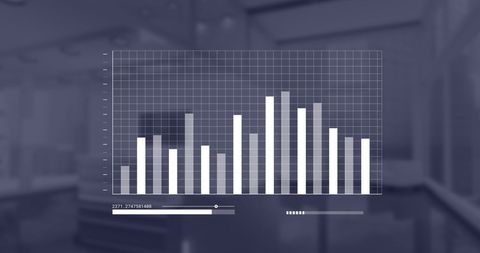
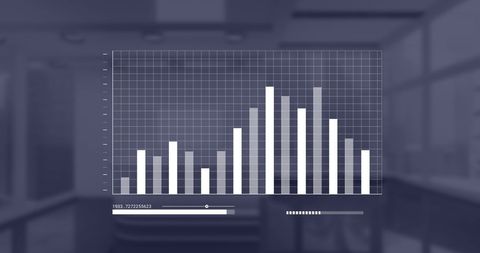
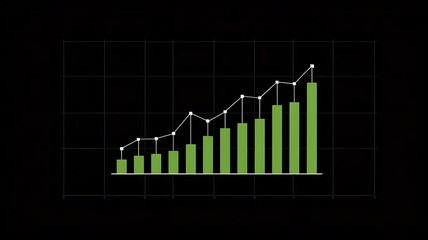
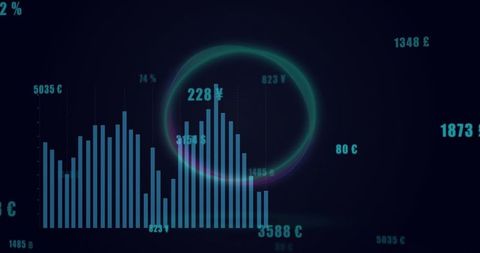
- Financial Data Processing Bar Graph on Minimalist Background
Financial Data Processing Bar Graph on Minimalist Background Image

A clean and minimalist bar graph representing financial data processing on a black background. Ideal for presentations, reports, and business analysis materials focused on global financial trends, data interpretation, or digital interface design elements. It conveys a sense of professionalism and clarity in data visualization.
Powered by 


downloads
Tags:
More
Credit Photo
If you would like to credit the Photo, here are some ways you can do so
Text Link
photo Link
<span class="text-link">
<span>
<a target="_blank" href=https://pikwizard.com/photo/financial-data-processing-bar-graph-on-minimalist-background/a5769c30387cfece2fa67a861cce25e2/>PikWizard</a>
</span>
</span>
<span class="image-link">
<span
style="margin: 0 0 20px 0; display: inline-block; vertical-align: middle; width: 100%;"
>
<a
target="_blank"
href="https://pikwizard.com/photo/financial-data-processing-bar-graph-on-minimalist-background/a5769c30387cfece2fa67a861cce25e2/"
style="text-decoration: none; font-size: 10px; margin: 0;"
>
<img src="https://pikwizard.com/pw/medium/a5769c30387cfece2fa67a861cce25e2.jpg" style="margin: 0; width: 100%;" alt="" />
<p style="font-size: 12px; margin: 0;">PikWizard</p>
</a>
</span>
</span>
Free (free of charge)
Free for personal and commercial use.
Author: Awesome Content
Similar Free Stock Images

Premium


Premium


Premium


Premium


Premium


Premium


Premium


Premium


Premium


Premium


Premium


Premium


Premium


Premium


Premium


Premium


Premium


Premium


Premium

Premium


Premium


Premium


Premium


Premium


Premium


Explore More Free Stock Images