- Home >
- Stock Photos >
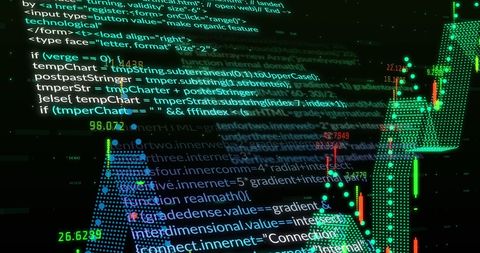
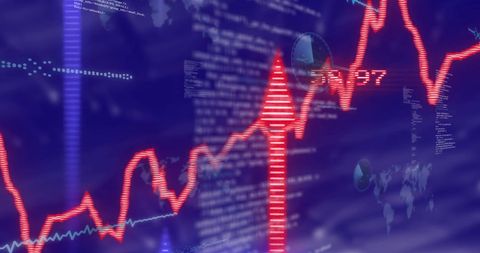
- Financial Data Processing Code Over Digital Graph
Financial Data Processing Code Over Digital Graph Image

Financial data and programming code are displayed over a digital graph, illustrating the intersection of finance and technology. Ideal for use in articles or presentations on stock market analysis, modern finance solutions, or data analytics trends and tools.

downloads
Tags:
More
Credit Photo
If you would like to credit the Photo, here are some ways you can do so
Text Link
photo Link
<span class="text-link">
<span>
<a target="_blank" href=https://pikwizard.com/photo/financial-data-processing-code-over-digital-graph/370e527c743a00daee7f49a50d413924/>PikWizard</a>
</span>
</span>
<span class="image-link">
<span
style="margin: 0 0 20px 0; display: inline-block; vertical-align: middle; width: 100%;"
>
<a
target="_blank"
href="https://pikwizard.com/photo/financial-data-processing-code-over-digital-graph/370e527c743a00daee7f49a50d413924/"
style="text-decoration: none; font-size: 10px; margin: 0;"
>
<img src="https://pikwizard.com/pw/medium/370e527c743a00daee7f49a50d413924.jpg" style="margin: 0; width: 100%;" alt="" />
<p style="font-size: 12px; margin: 0;">PikWizard</p>
</a>
</span>
</span>
Free (free of charge)
Free for personal and commercial use.
Author: People Creations