
- Home >
- Stock Photos >
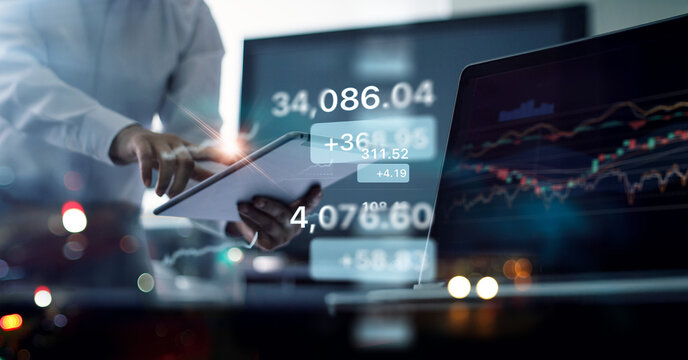
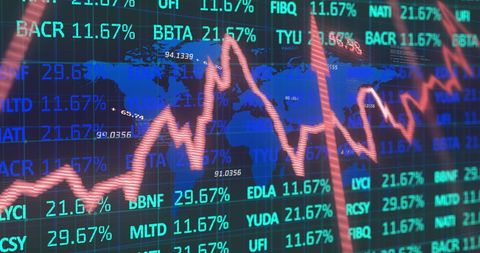
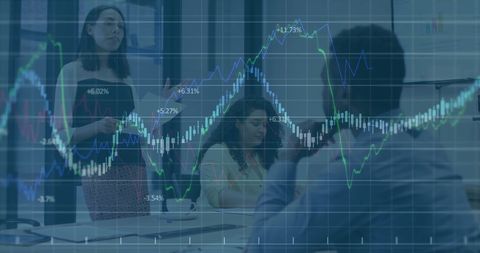
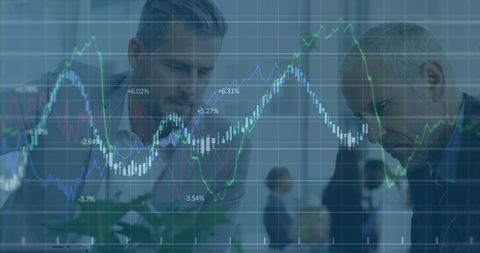
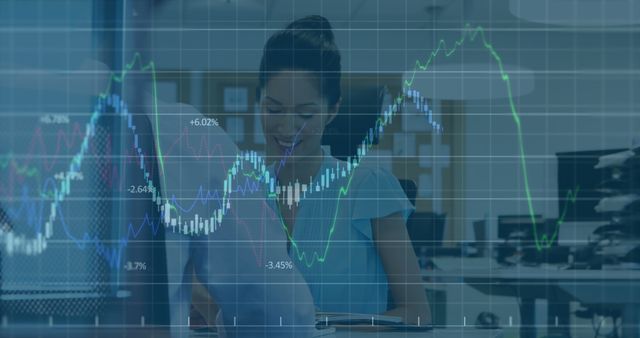
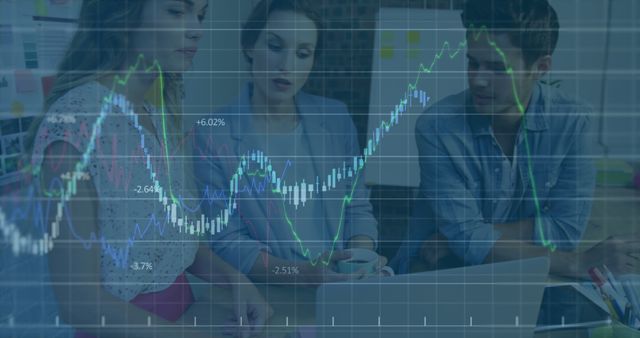
- Financial Data Processing in Modern Office Environment
Financial Data Processing in Modern Office Environment Image

Featuring superimposed graphs and stock market data overlaying an office desk, this image symbolizes the intersection of technology and global financial markets. Suitable for use in business presentations, financial reports, or articles about economic trends, it highlights the analytical aspects of finance through digital technologies.
Powered by 


downloads
Tags:
More
Credit Photo
If you would like to credit the Photo, here are some ways you can do so
Text Link
photo Link
<span class="text-link">
<span>
<a target="_blank" href=https://pikwizard.com/photo/financial-data-processing-in-modern-office-environment/00dc24716dbd1b71cd4c56b5b9213611/>PikWizard</a>
</span>
</span>
<span class="image-link">
<span
style="margin: 0 0 20px 0; display: inline-block; vertical-align: middle; width: 100%;"
>
<a
target="_blank"
href="https://pikwizard.com/photo/financial-data-processing-in-modern-office-environment/00dc24716dbd1b71cd4c56b5b9213611/"
style="text-decoration: none; font-size: 10px; margin: 0;"
>
<img src="https://pikwizard.com/pw/medium/00dc24716dbd1b71cd4c56b5b9213611.jpg" style="margin: 0; width: 100%;" alt="" />
<p style="font-size: 12px; margin: 0;">PikWizard</p>
</a>
</span>
</span>
Free (free of charge)
Free for personal and commercial use.
Author: Authentic Images
Similar Free Stock Images

Premium


Premium

Premium


Premium


Premium


Premium


Premium


Premium


Premium


Premium


Premium


Premium

Premium

Premium


Premium


Premium

Premium


Premium

Premium


Premium


Premium


Premium


Premium


Premium


Premium


Explore More Free Stock Images