- Home >
- Stock Photos >
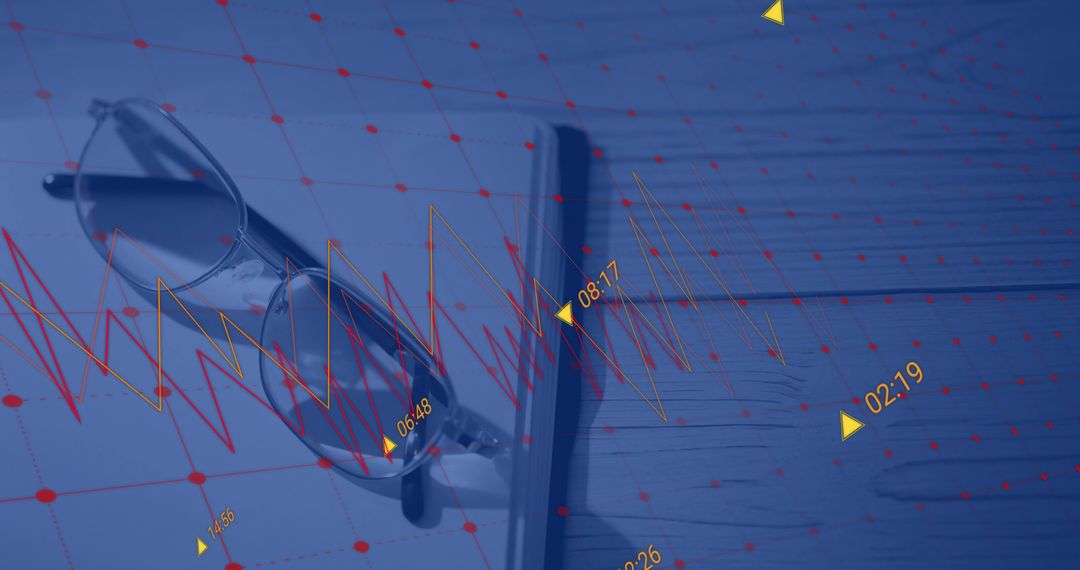
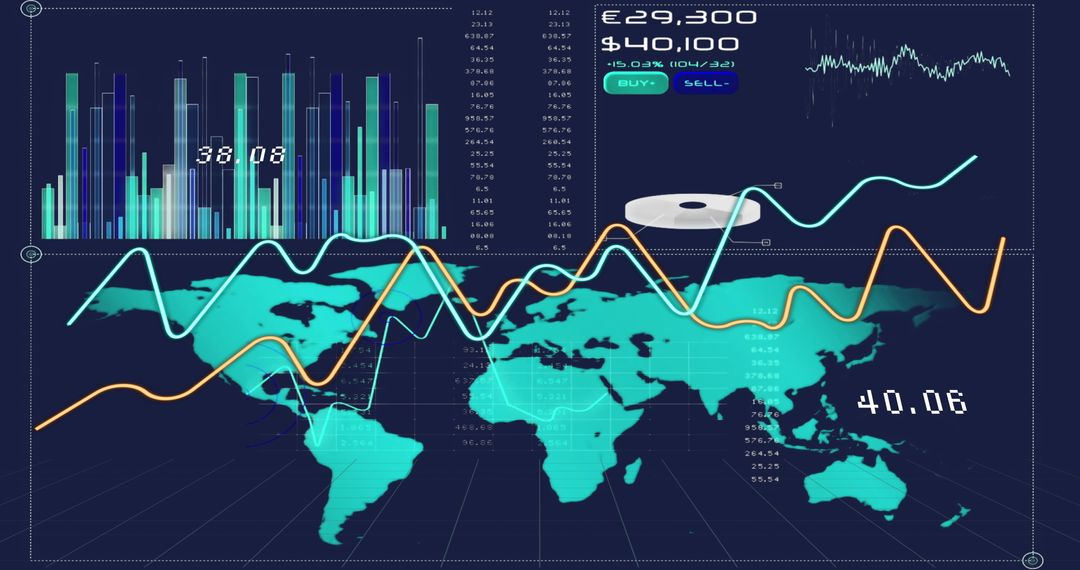
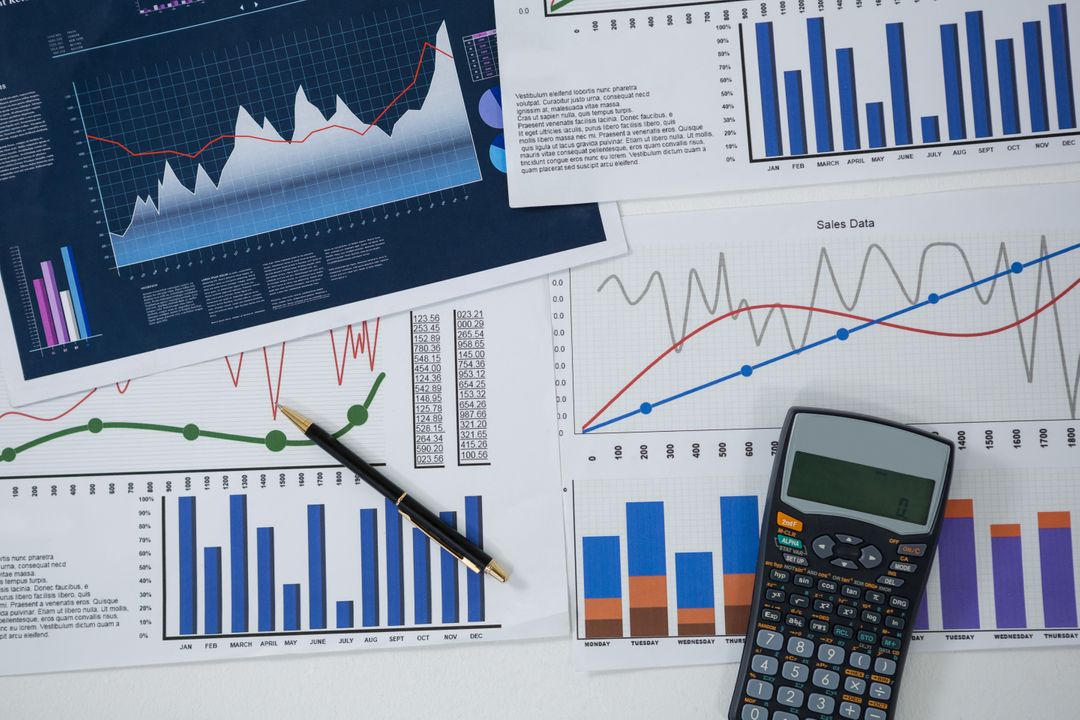
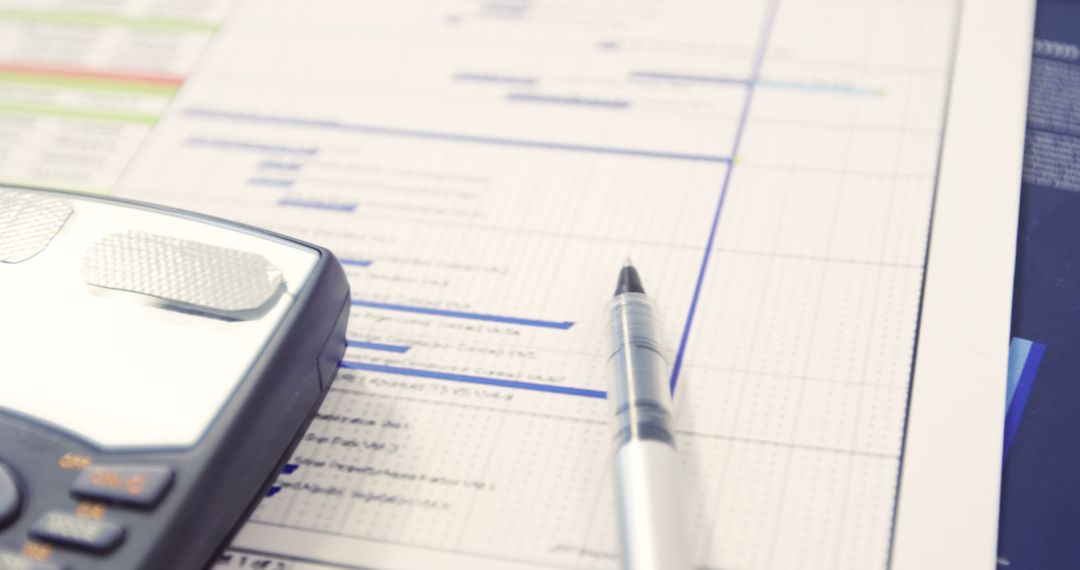
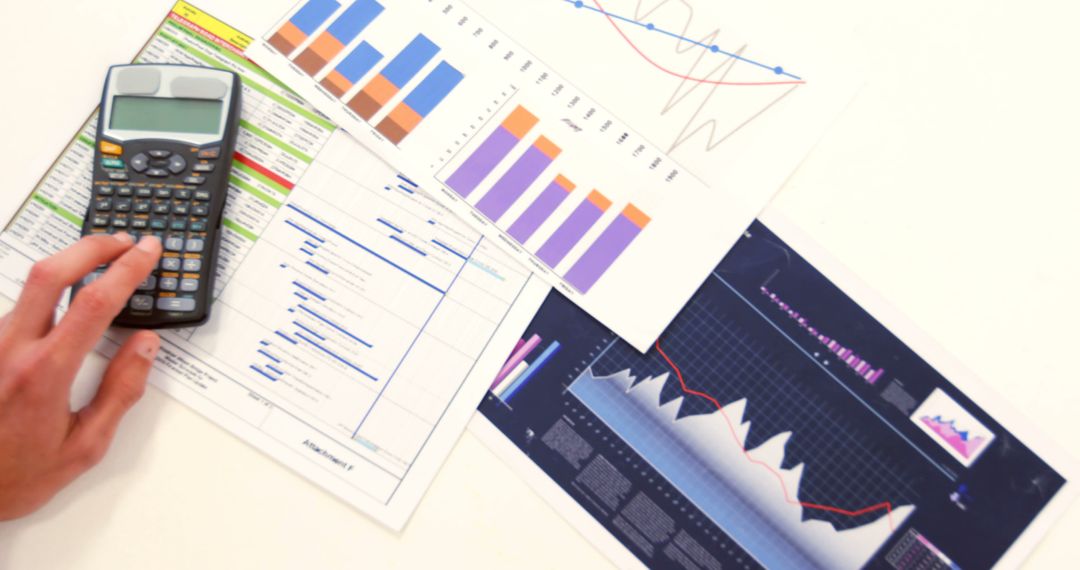
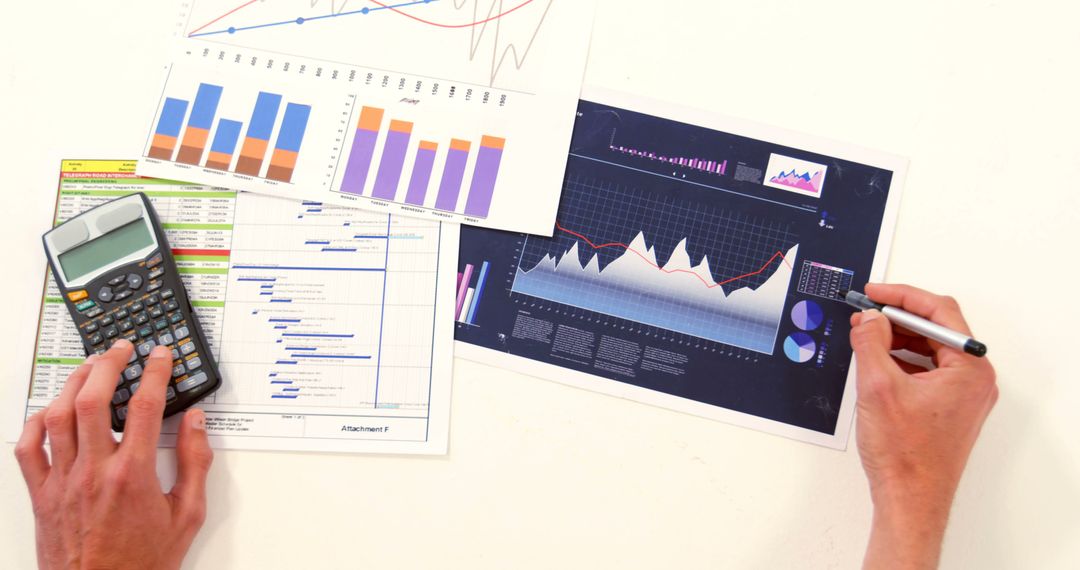
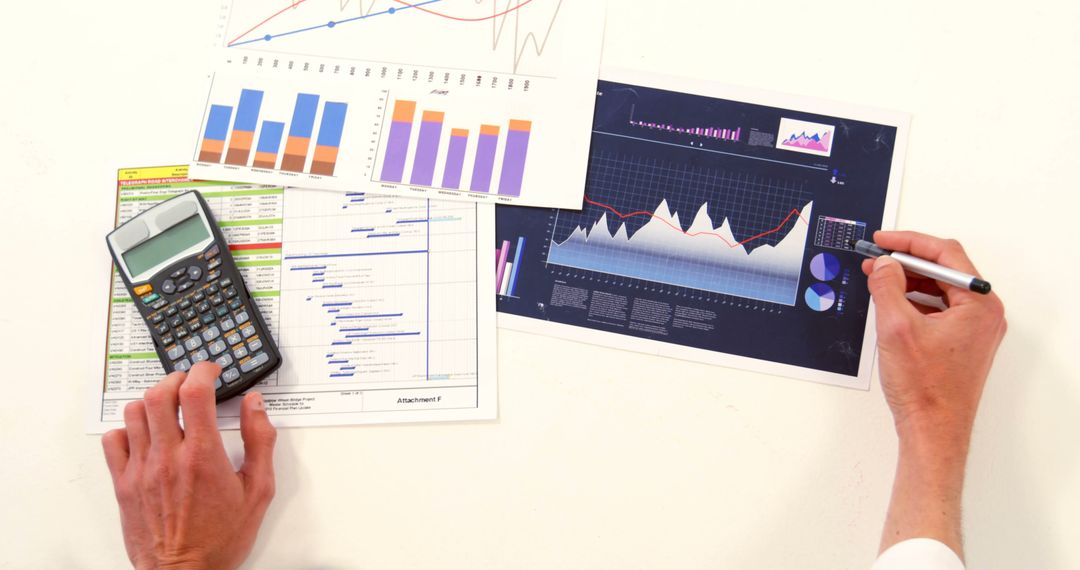
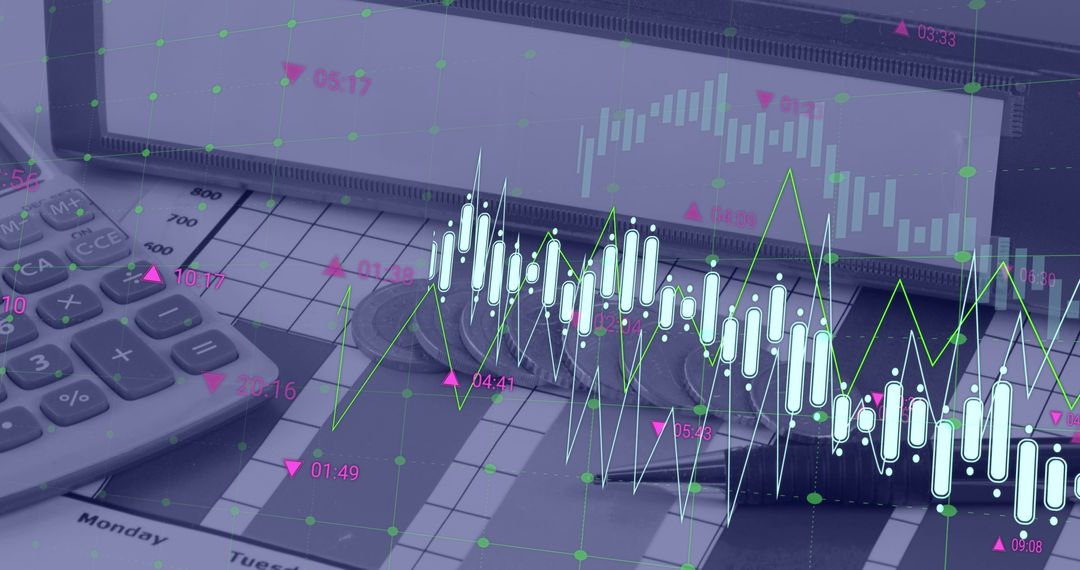
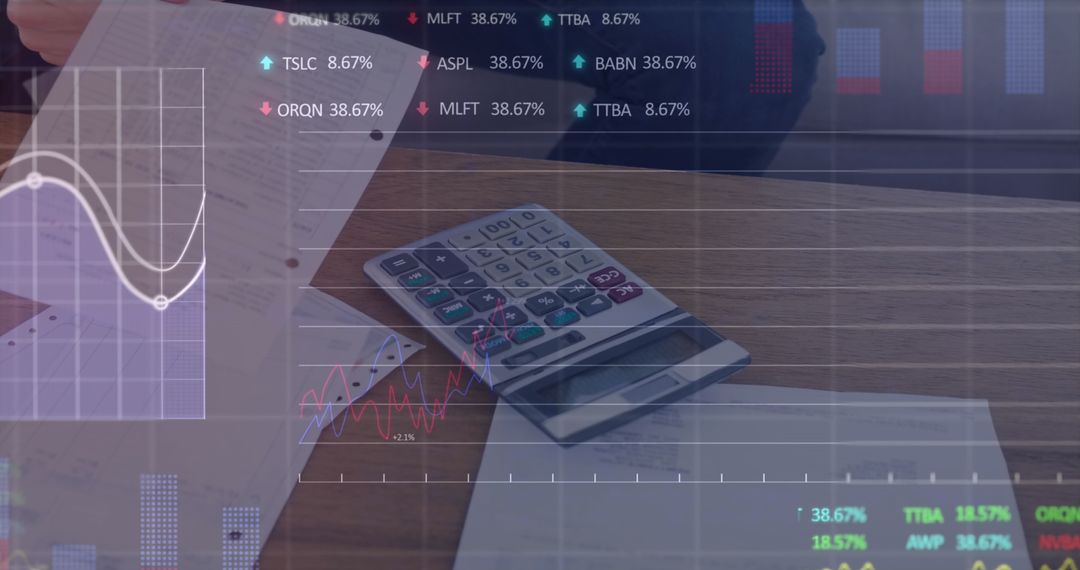
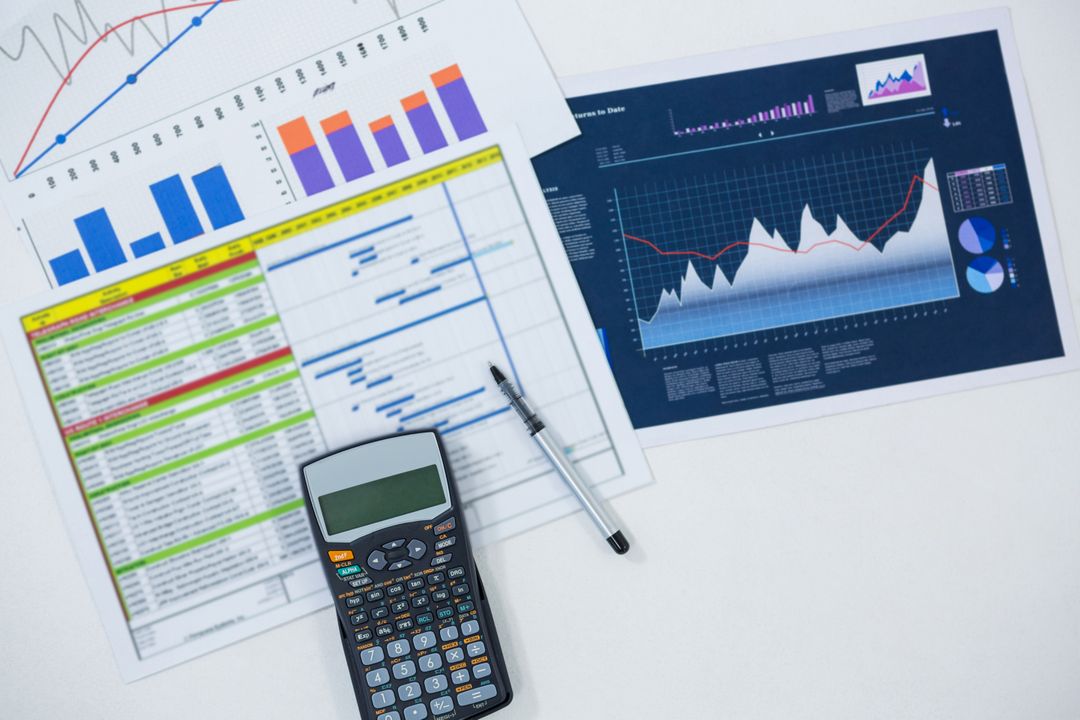
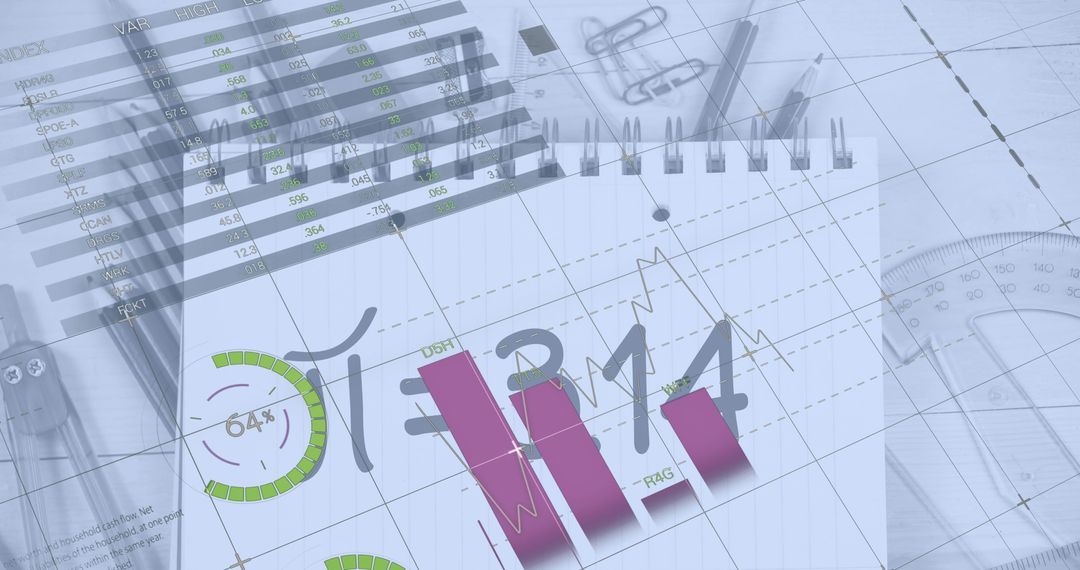
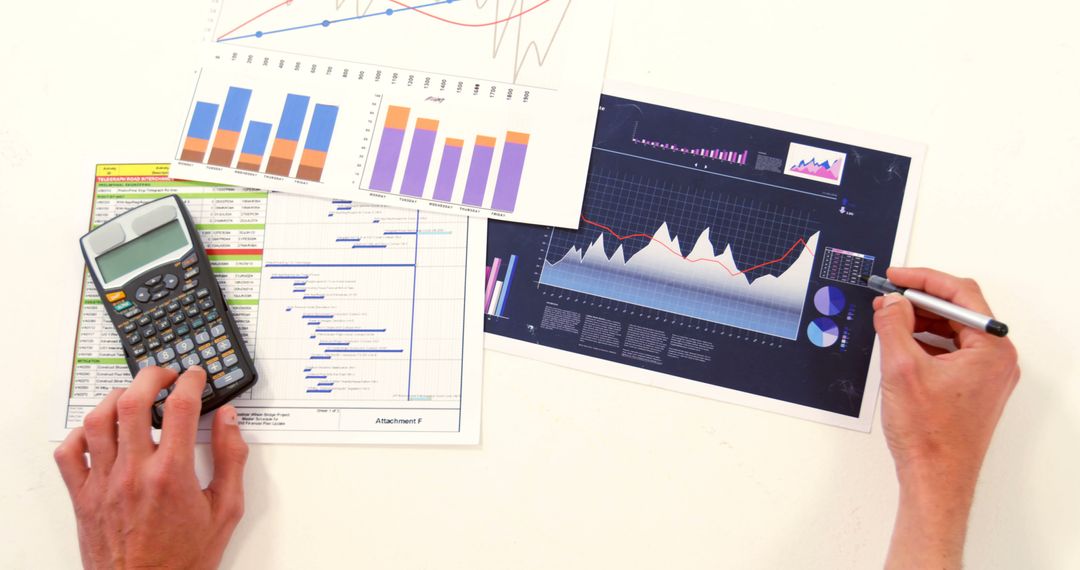
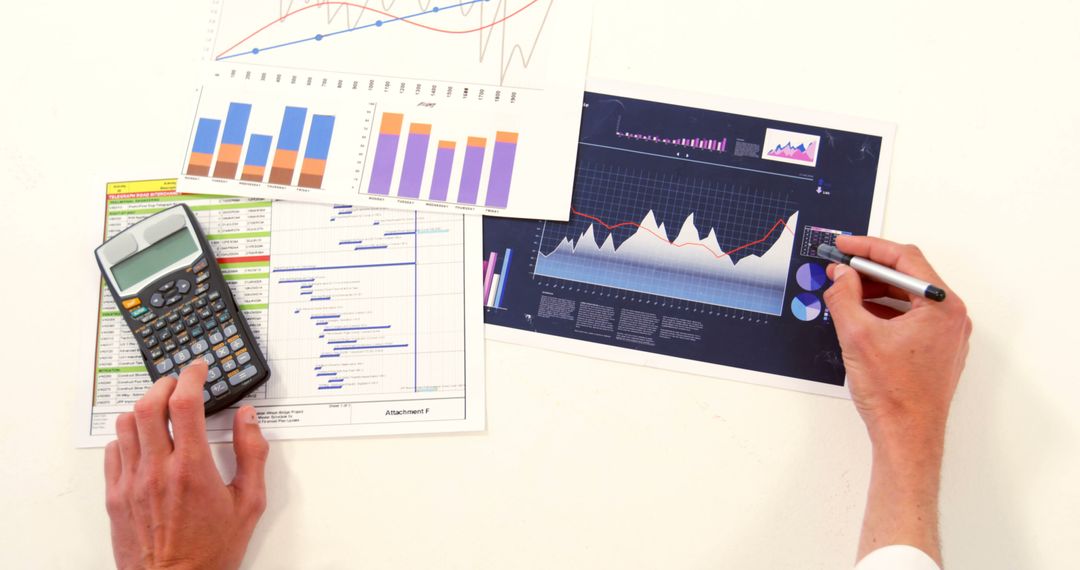
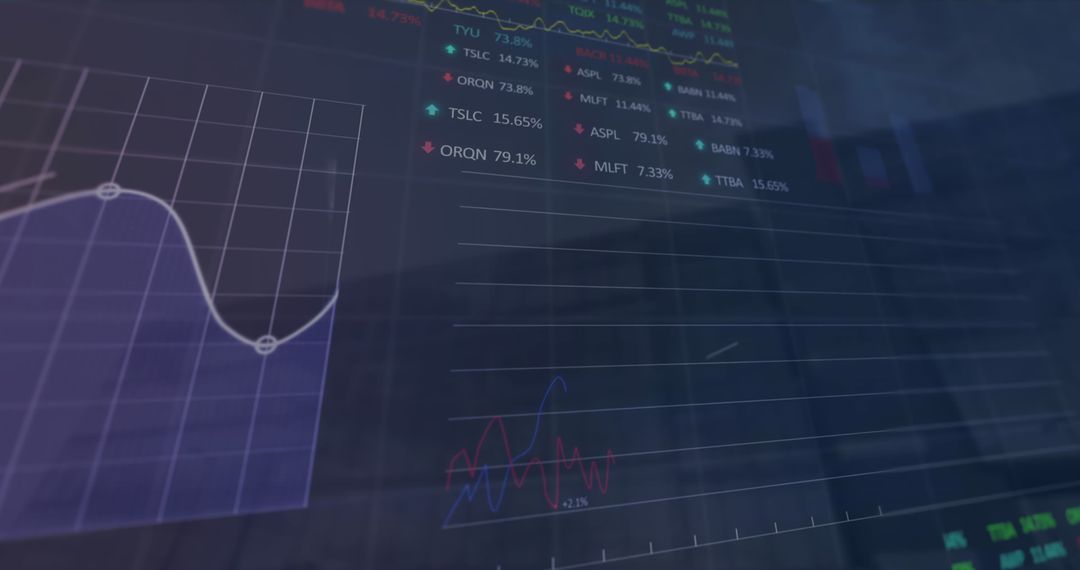
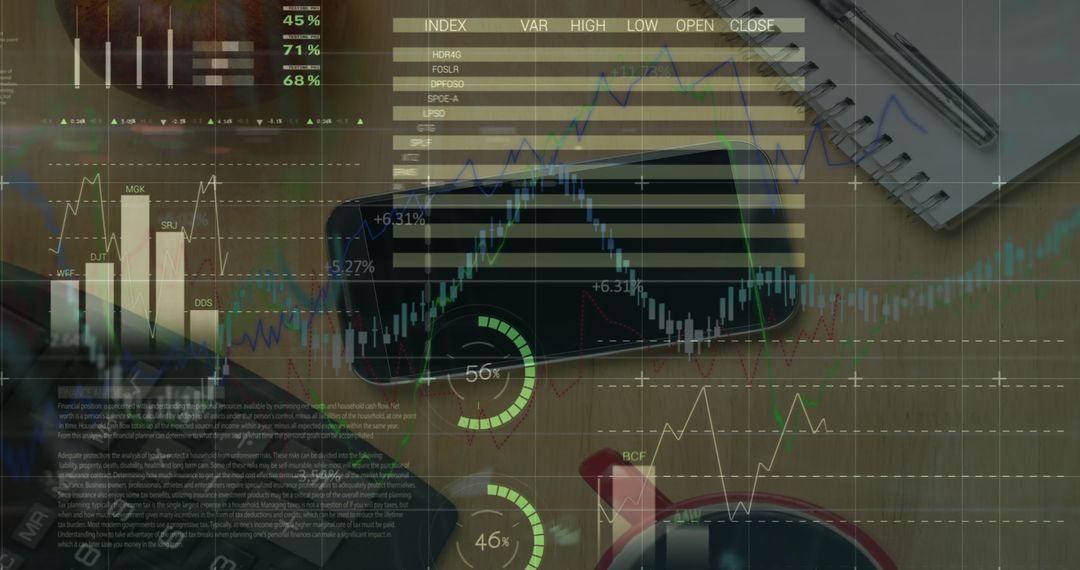
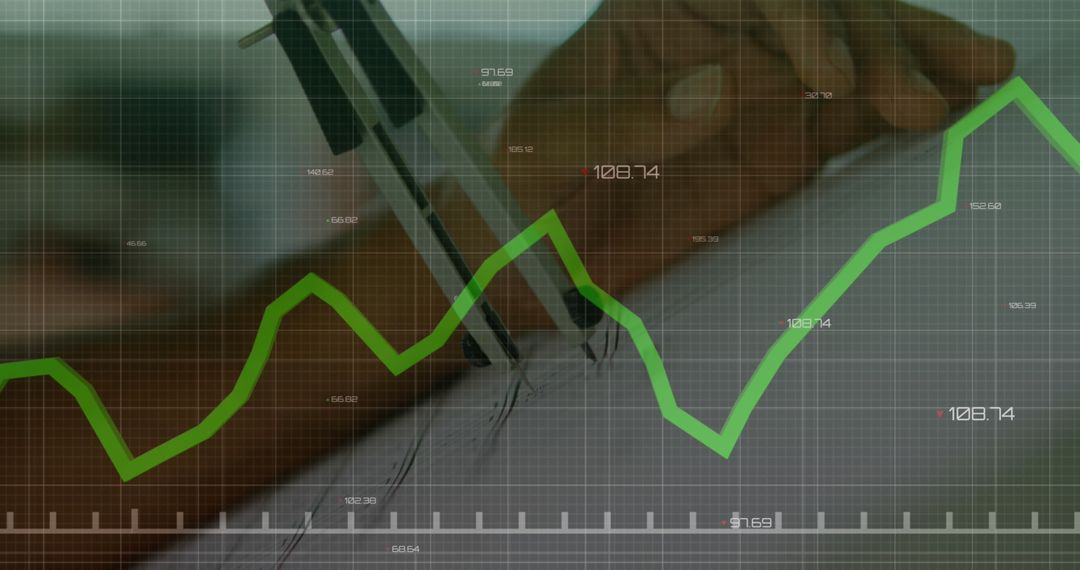
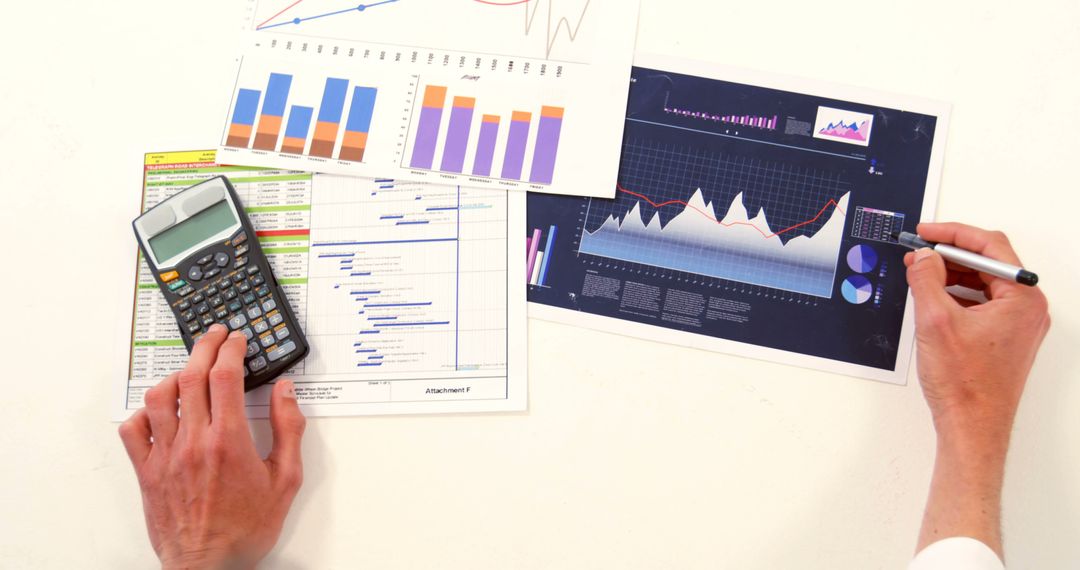
- Financial Data Processing in Office With Digital Composite Charts
Financial Data Processing in Office With Digital Composite Charts Image

This dynamic scene overlays financial charts and graphs digitally on office supplies, including a calculator, red binder, and documents. Suitable for conveying concepts in finance consultations, digital marketing, financial education, or business analysis services.
Powered by  - Get 15% off with code: PIKWIZARD15


0
downloads
downloads
Tags:
More
Credit Photo
If you would like to credit the Photo, here are some ways you can do so
Text Link
photo Link
<span class="text-link">
<span>
<a target="_blank" href=https://pikwizard.com/photo/financial-data-processing-in-office-with-digital-composite-charts/46691294bb60ef632e1218ab655ead38/>PikWizard</a>
</span>
</span>
<span class="image-link">
<span
style="margin: 0 0 20px 0; display: inline-block; vertical-align: middle; width: 100%;"
>
<a
target="_blank"
href="https://pikwizard.com/photo/financial-data-processing-in-office-with-digital-composite-charts/46691294bb60ef632e1218ab655ead38/"
style="text-decoration: none; font-size: 10px; margin: 0;"
>
<img src="https://pikwizard.com/pw/medium/46691294bb60ef632e1218ab655ead38.jpg" style="margin: 0; width: 100%;" alt="" />
<p style="font-size: 12px; margin: 0;">PikWizard</p>
</a>
</span>
</span>
Free (free of charge)
Free for personal and commercial use.
Author: Awesome Content
Similar Free Stock Images

Premium


Premium


Premium


Premium


Premium


Premium


Premium


Premium

Premium


Premium

Premium


Premium


Premium


Premium

Premium


Premium


Premium


Premium


Premium


Premium


Premium


Premium


Premium


Premium