
- Home >
- Stock Photos >
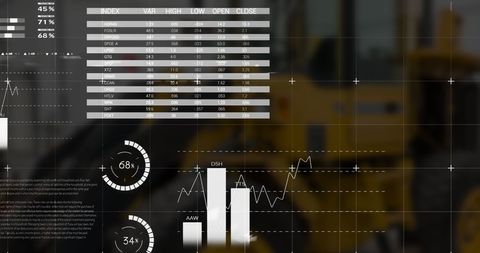
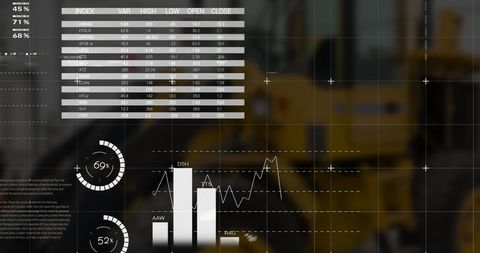
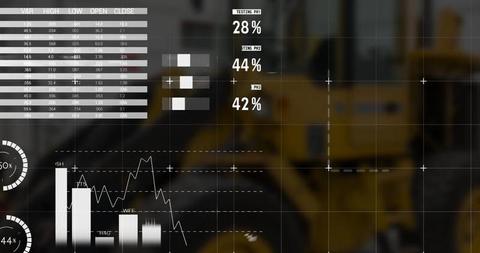
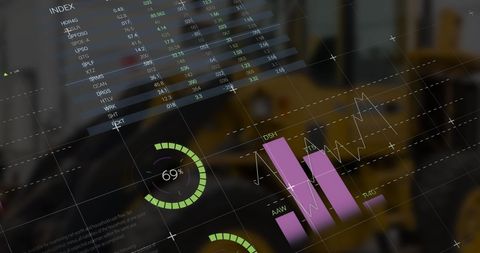
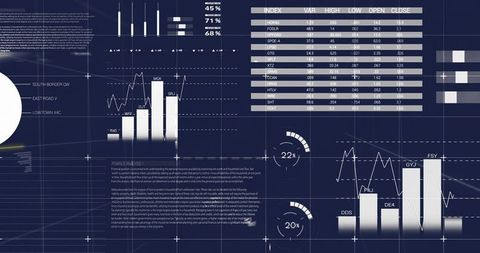
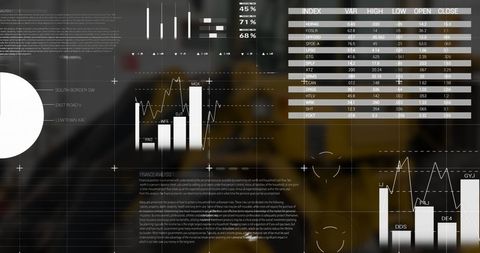
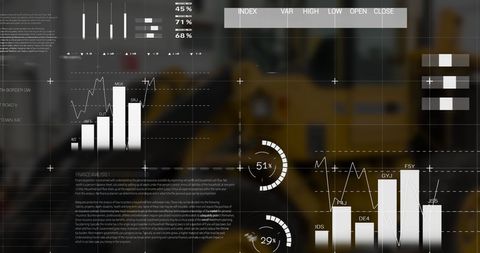
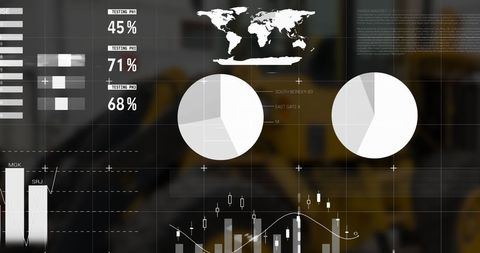
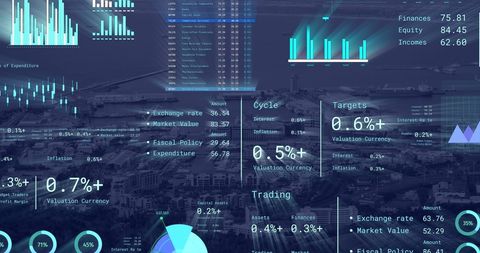
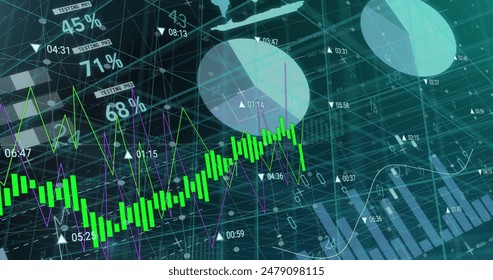
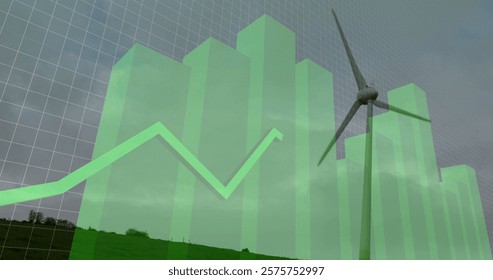
- Financial Data Processing Interface with Charts and Analytics
Financial Data Processing Interface with Charts and Analytics Image
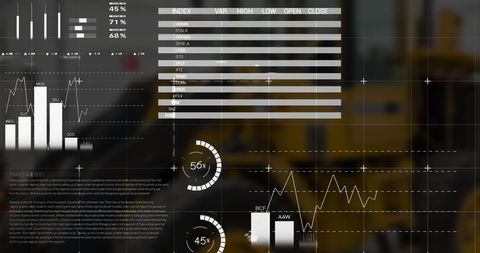
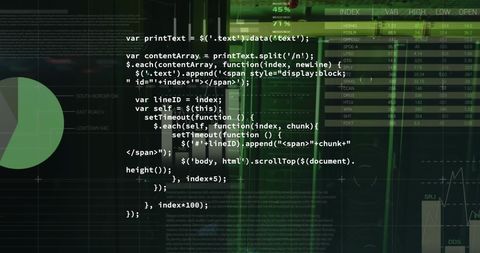
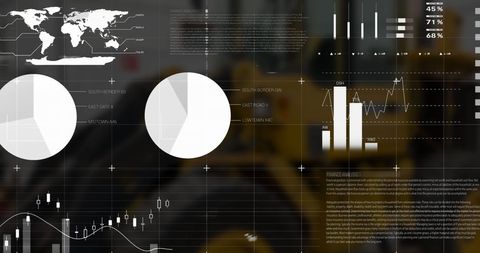
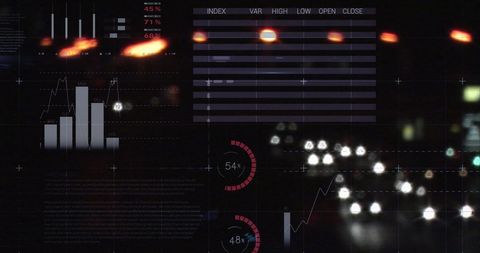
Digital representation shows financial data processing with charts, indicators, and analytics. Information highlights stock—high, low, open, and close values. Useful for presentations focused on market trends or financial analysis, illustrating tech-driven strategies in business and finance sectors.
Powered by  - Get 15% off with code: PIKWIZARD15


downloads
Tags:
More
Credit Photo
If you would like to credit the Photo, here are some ways you can do so
Text Link
photo Link
<span class="text-link">
<span>
<a target="_blank" href=https://pikwizard.com/photo/financial-data-processing-interface-with-charts-and-analytics/27a1d7648c7ee636bb0e1fc1851d8049/>PikWizard</a>
</span>
</span>
<span class="image-link">
<span
style="margin: 0 0 20px 0; display: inline-block; vertical-align: middle; width: 100%;"
>
<a
target="_blank"
href="https://pikwizard.com/photo/financial-data-processing-interface-with-charts-and-analytics/27a1d7648c7ee636bb0e1fc1851d8049/"
style="text-decoration: none; font-size: 10px; margin: 0;"
>
<img src="https://pikwizard.com/pw/medium/27a1d7648c7ee636bb0e1fc1851d8049.jpg" style="margin: 0; width: 100%;" alt="" />
<p style="font-size: 12px; margin: 0;">PikWizard</p>
</a>
</span>
</span>
Free (free of charge)
Free for personal and commercial use.
Author: Awesome Content
Similar Free Stock Images

Premium


Premium


Premium


Premium
Premium


Premium


Premium


Premium


Premium


Premium

Premium


Premium


Premium


Premium


Premium


Premium


Premium


Premium
Premium


Premium


Premium


Premium


Premium


Premium

Premium

Explore More Free Stock Images