- Home >
- Stock Photos >
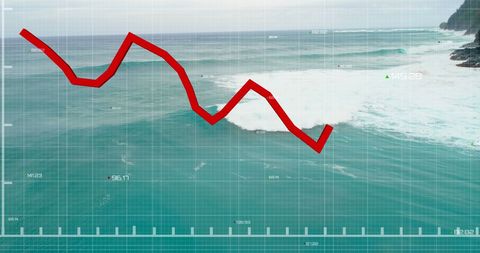
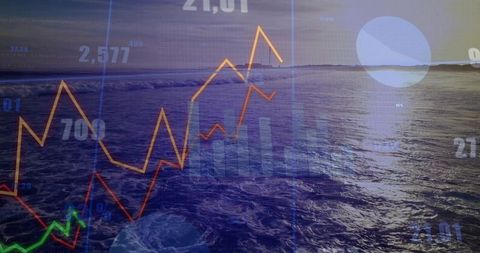
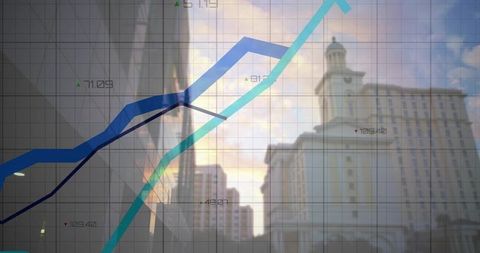
- Financial Data Processing Over Seascape Background
Financial Data Processing Over Seascape Background Image
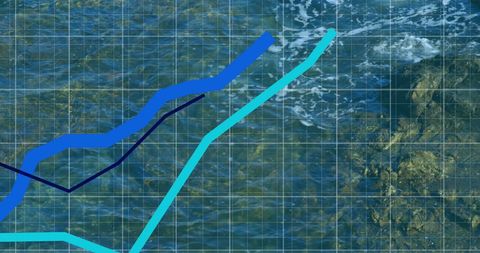
This innovative visual blend of financial data processing superimposed on a seascape is ideal for conveying themes of global finance, economic forecasts, and technological advancements. Perfect for businesses and marketers needing imagery that highlights digital transformation in finance or for presentations that communicate interconnectedness in a volatile market landscape.

downloads
Tags:
More
Credit Photo
If you would like to credit the Photo, here are some ways you can do so
Text Link
photo Link
<span class="text-link">
<span>
<a target="_blank" href=https://pikwizard.com/photo/financial-data-processing-over-seascape-background/59b76579c3235ef450fb0debf0b453c4/>PikWizard</a>
</span>
</span>
<span class="image-link">
<span
style="margin: 0 0 20px 0; display: inline-block; vertical-align: middle; width: 100%;"
>
<a
target="_blank"
href="https://pikwizard.com/photo/financial-data-processing-over-seascape-background/59b76579c3235ef450fb0debf0b453c4/"
style="text-decoration: none; font-size: 10px; margin: 0;"
>
<img src="https://pikwizard.com/pw/medium/59b76579c3235ef450fb0debf0b453c4.jpg" style="margin: 0; width: 100%;" alt="" />
<p style="font-size: 12px; margin: 0;">PikWizard</p>
</a>
</span>
</span>
Free (free of charge)
Free for personal and commercial use.
Author: Creative Art