- Home >
- Stock Photos >
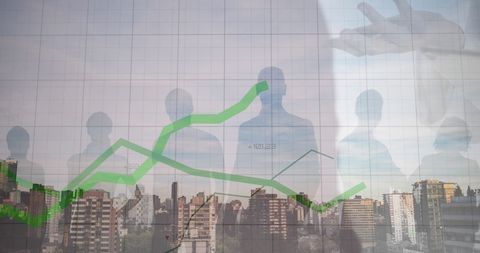
- Financial Data Processing Overlaid on Urban Cityscape
Financial Data Processing Overlaid on Urban Cityscape Image

Dynamic visualization of financial data processing blended with a city skyline, creating a modern theme of business and economics. Pie charts and graphs illustrate analysis and market trends, symbolizing corporate strategy and technology. Ideal for presentations on economic trends, business reports, marketing material, or websites focused on financial advisory services.
Powered by 


2
downloads
downloads
Tags:
More
Credit Photo
If you would like to credit the Photo, here are some ways you can do so
Text Link
photo Link
<span class="text-link">
<span>
<a target="_blank" href=https://pikwizard.com/photo/financial-data-processing-overlaid-on-urban-cityscape/5ab9969bc5f7d6c509a169bbc064a0c9/>PikWizard</a>
</span>
</span>
<span class="image-link">
<span
style="margin: 0 0 20px 0; display: inline-block; vertical-align: middle; width: 100%;"
>
<a
target="_blank"
href="https://pikwizard.com/photo/financial-data-processing-overlaid-on-urban-cityscape/5ab9969bc5f7d6c509a169bbc064a0c9/"
style="text-decoration: none; font-size: 10px; margin: 0;"
>
<img src="https://pikwizard.com/pw/medium/5ab9969bc5f7d6c509a169bbc064a0c9.jpg" style="margin: 0; width: 100%;" alt="" />
<p style="font-size: 12px; margin: 0;">PikWizard</p>
</a>
</span>
</span>
Free (free of charge)
Free for personal and commercial use.
Author: Awesome Content
Similar Free Stock Images

Premium


Premium


Premium


Premium


Premium


Premium


Premium


Premium


Premium


Premium


Premium


Premium


Premium


Premium


Premium


Premium


Premium


Premium


Premium


Premium


Premium


Premium


Premium


Premium


Premium