- Home >
- Stock Photos >
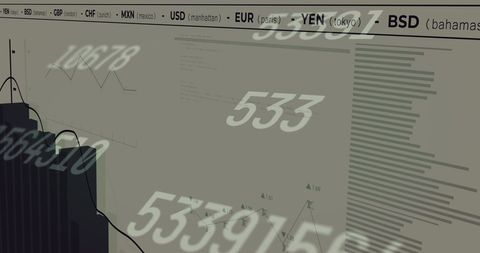
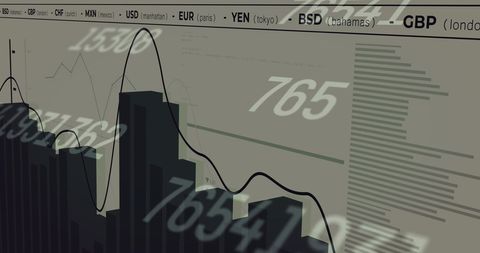
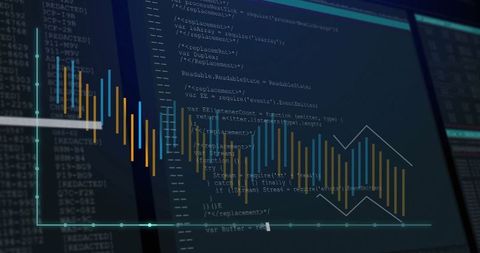
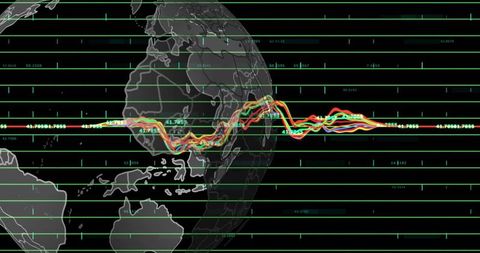
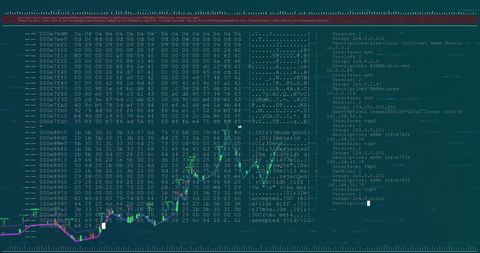
- Financial Data Processing Screen with Global Currencies Representation
Financial Data Processing Screen with Global Currencies Representation Image

Visual showing financial statistics and data on virtual screen with international currency representations including Euro, Yen, USD, and more. Ideal for illustrating themes related to business analysis, financial markets, data visualization, and international finance. Suitable for articles, presentations, or websites about technology in financial sectors or economic reports.

downloads
Tags:
More
Credit Photo
If you would like to credit the Photo, here are some ways you can do so
Text Link
photo Link
<span class="text-link">
<span>
<a target="_blank" href=https://pikwizard.com/photo/financial-data-processing-screen-with-global-currencies-representation/8961cd70656538b3b26e7aa5dd540598/>PikWizard</a>
</span>
</span>
<span class="image-link">
<span
style="margin: 0 0 20px 0; display: inline-block; vertical-align: middle; width: 100%;"
>
<a
target="_blank"
href="https://pikwizard.com/photo/financial-data-processing-screen-with-global-currencies-representation/8961cd70656538b3b26e7aa5dd540598/"
style="text-decoration: none; font-size: 10px; margin: 0;"
>
<img src="https://pikwizard.com/pw/medium/8961cd70656538b3b26e7aa5dd540598.jpg" style="margin: 0; width: 100%;" alt="" />
<p style="font-size: 12px; margin: 0;">PikWizard</p>
</a>
</span>
</span>
Free (free of charge)
Free for personal and commercial use.
Author: Creative Art