
- Home >
- Stock Photos >
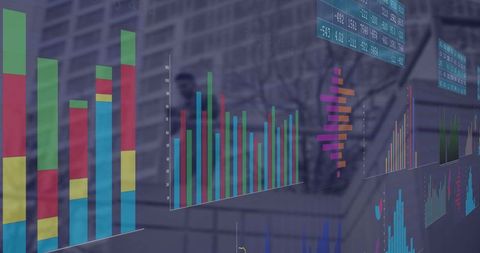
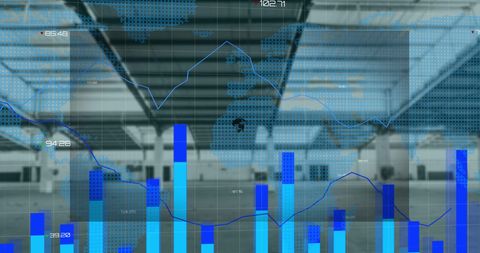
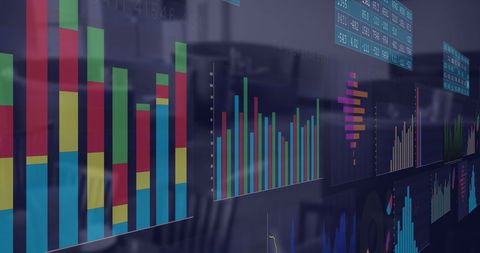
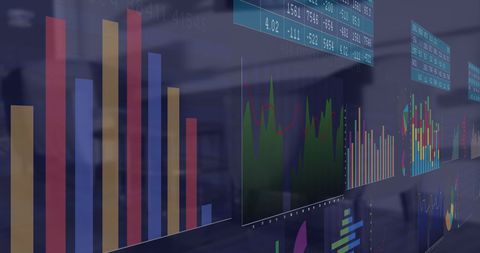
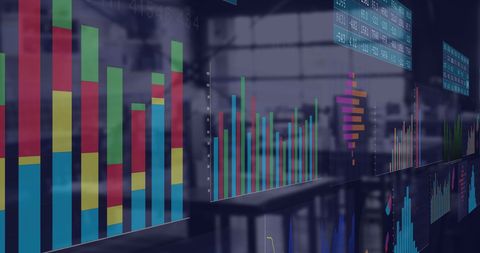
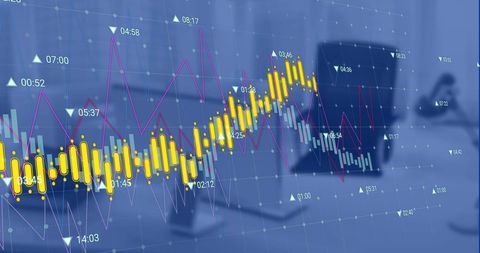
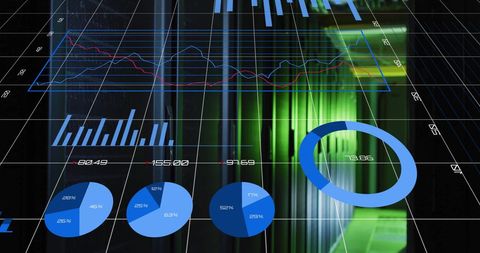
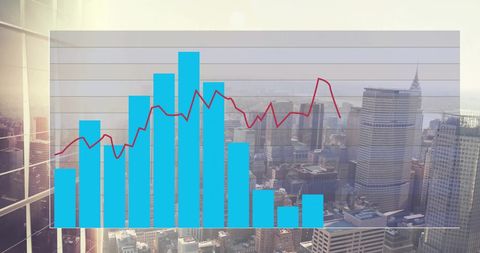
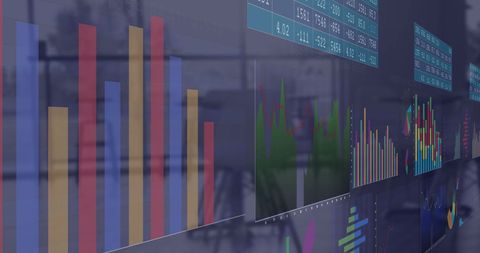
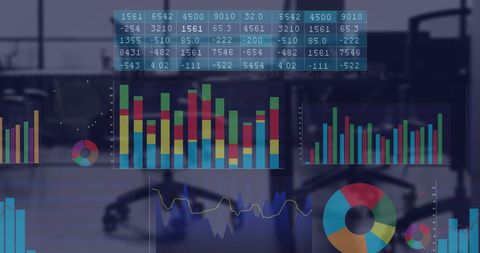
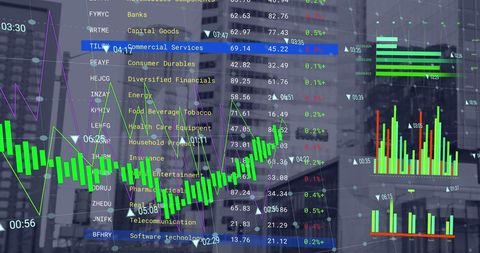
- Financial Data Processing Visualization in Modern Office Environment
Financial Data Processing Visualization in Modern Office Environment Image
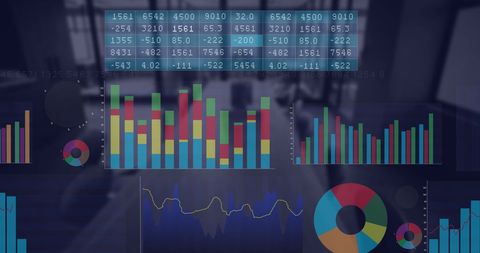
Image featuring colorful financial bar graphs and pie charts overlaying an empty office background conveys data dynamics in a modern business context. Suitable for presentations, reports, and articles focused on financial technology, corporate data analysis, strategies for data-driven business decisions, and showcasing advancements in digital analytics solutions.
Powered by 


downloads
Tags:
More
Credit Photo
If you would like to credit the Photo, here are some ways you can do so
Text Link
photo Link
<span class="text-link">
<span>
<a target="_blank" href=https://pikwizard.com/photo/financial-data-processing-visualization-in-modern-office-environment/ec15376035f3372ec7b298f2d0fe8a6e/>PikWizard</a>
</span>
</span>
<span class="image-link">
<span
style="margin: 0 0 20px 0; display: inline-block; vertical-align: middle; width: 100%;"
>
<a
target="_blank"
href="https://pikwizard.com/photo/financial-data-processing-visualization-in-modern-office-environment/ec15376035f3372ec7b298f2d0fe8a6e/"
style="text-decoration: none; font-size: 10px; margin: 0;"
>
<img src="https://pikwizard.com/pw/medium/ec15376035f3372ec7b298f2d0fe8a6e.jpg" style="margin: 0; width: 100%;" alt="" />
<p style="font-size: 12px; margin: 0;">PikWizard</p>
</a>
</span>
</span>
Free (free of charge)
Free for personal and commercial use.
Author: Authentic Images
Similar Free Stock Images
Premium


Premium


Premium


Premium


Premium


Premium


Premium
Premium

Premium


Premium


Premium

Premium


Premium


Premium

Premium


Premium


Premium


Premium


Premium


Premium


Premium


Premium


Premium

Premium
Premium

Explore More Free Stock Images